
Public transportation ridership up in 2nd quarter
All major modes of public transportation increased. Light rail and heavy rail saw the largest hike, with increases of 4.3% and 2.5% respectively.

Nearly 2.7 billion trips were taken on U.S. public transportation in the second quarter of 2012 as ridership increased by 1.6% over the second quarter of 2011, according to a report released today by the American Public Transportation Association (APTA). This was the sixth consecutive quarterly increase.
All major modes of public transportation increased. Light rail and heavy rail saw the largest increases in the second quarter with increases of 4.3% and 2.5% respectively. Some public transit systems throughout all areas of the U.S. reported record ridership for the second quarter, including in the following cities: Ann Arbor (Mich.), Boston, Fort Myers (Fla.), Grand Rapids (Mich.), Lewisville (Texas), Oklahoma City (Okla.), Olympia (Wash.), Portland (Ore.), and San Carlos (Calif.).
“Since nearly 60 percent of the trips taken on public transportation are work commutes, public transit is a vital service for cities and towns nationwide,” said APTA President and CEO Michael Melaniphy. “Public transportation not only enables people to get to work, but development around public transit helps to create an economically prosperous community.
“In some areas of the country, local and regional economies are rebounding, and not surprisingly, public transit ridership is up in regions where jobs are increasing and employment is up,” said Melaniphy.
Some of the cities experiencing public transit ridership increases as their local economy improves includes: San Francisco (and the Bay area), Los Angeles, Pittsburgh, Louisville, Salt Lake City, Denver, Boston, Chicago, and Phoenix.
Pointing out that gas prices declined in the second quarter, Melaniphy said, “Even though gas prices declined in the second quarter, more people decided to take public transportation. This goes to show that there is a growing public demand for public transportation services and the next Congress and President must address this issue.”
April - June 2012 Ridership Breakdown
Nationally, heavy rail ridership increased by 2.5% and 11 out of 15 heavy rail systems (subways and elevated trains) experienced ridership increases in the second quarter of 2012 over the same period in 2011. The heavy rail systems with the highest increases in ridership for 2012 were in the following cities: Cleveland (9.9%); San Francisco (6.8%); and Chicago (4.4%).
Light rail ridership increased by 4.3% in the second quarter, as 21 out of 27 light rail systems reported an increase in ridership from April through June 2012. Light rail systems saw double digit increases in the second quarter in six cities: Memphis, Tenn. (36.7%); Salt Lake City (28.8%); Pittsburgh (21.2%); Los Angeles (13.8%); Sacramento, Calif. (13.4%); and Seattle (10.3%). Other light rail systems with large increases were in the following cities: Boston (8.0%); Phoenix (7.3%); and New Orleans (7.0%).
Eighteen out of 28 commuter rail systems reported ridership increases and commuter rail ridership grew by 1.7%. Commuter rail ridership saw a triple digit increase in Lewisville, Texas (258.0%) due to new service and saw double digit increases in the second quarter in the following cities: Austin, Texas (14.8%); Seattle (14.6%); San Carlos, Calif. (13.3%); and Stockton, Calif. (12.2%).
Other commuter rail systems showing high increases were located in the following cities: Salt Lake City (7.4%); Anchorage, Alaska (7.1%); Portland, Ore. (6.7%); Harrisburg-Philadelphia (6.2%); Baltimore (5.8%); and Los Angeles (5.8%).
Nationally, bus ridership rose by nearly one percent from April through June of 2012, some of the highest bus ridership increases in large cities were reported in: Oakland, Calif. (9.5%); Providence, R.I. (9.3%); Saint Louis, Mo. (6.7%); Long Beach, Calif. (5.2%); Arlington Heights, Ill. (4.5%); and Denver (4.5%).
Demand response (paratransit) increased in the second quarter of 2012 by 2.2%.
To see the complete APTA ridership report go to:
http://www.apta.com/resources/statistics/Documents/Ridership/2012-q2-ridership-APTA.pdf
More Paratransit

METRO Magazine Announces 2026 Innovative Solutions Awards Winners
Projects Recognized for Advancing Mobility Through Technology, Accessibility, Workforce Innovation, and Operational Excellence
Read More →Biz Briefs: STV teams with Amtrak, Motorcoach Operators Boost Fleet and Land Contracts, and More
From manufacturers and suppliers to transit agencies and motorcoach operators, these updates offer a snapshot of the projects, partnerships and business moves driving the industry forward.
Read More →
Biz Briefs: Masabi Teams with St. Louis Metro and More
In METRO's latest installment, we take a look at recent news from Transdev, Hitachi, and more partnerships making headlines across the transportation sector.
Read More →
New York MTA Leverages Zoning Program to Advance Station Accessibility
Accessibility enhancements at Nevins St Station will be financed through a development agreement tied to the MTA's Zoning for Accessibility initiative.
Read More →
Reinventing Fleet Maintenance with Real-time Visibility and AI
Transit leaders need to know what needs fixing, where to look, who is responsible, when work is completed, and what it costs without having to chase information across disconnected systems.
Read More →
SamTrans Sets Priorities for Potential Connect Bay Area Revenue
The board-approved framework allocates future funding to maintaining service, rider improvements, equity initiatives, and infrastructure repairs.
Read More →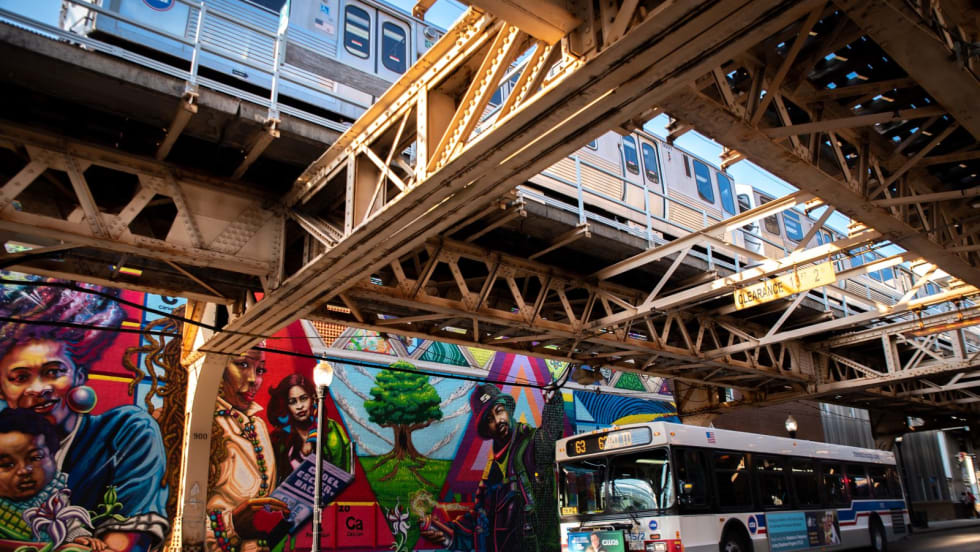
Chicago's NITA Act Moves Into Next Phase as Service Improvements Begin
Rider-focused improvements will begin rolling out across the system immediately as CTA, Metra, and Pace increase service this summer in the six-county region.
Read More →
2026 METRO Buyer’s Guide & Directory
Searching for the right vehicles, technology, equipment, or services for your public transit or motorcoach operation? This industry guide brings together manufacturers and suppliers from across the transportation market — all in one place. Download it to connect with the companies that help agencies and operators improve mobility, enhance operations, and move their organizations forward.
Read More →
Rays the Mark Foundation to Honor CDTA’s Emily DeVito at October Fundraiser
Event at Chicago-area Ravisloe Country Club will support DeVito, a transit employee and mother of twins battling kidney failure and awaiting a transplant.
Read More →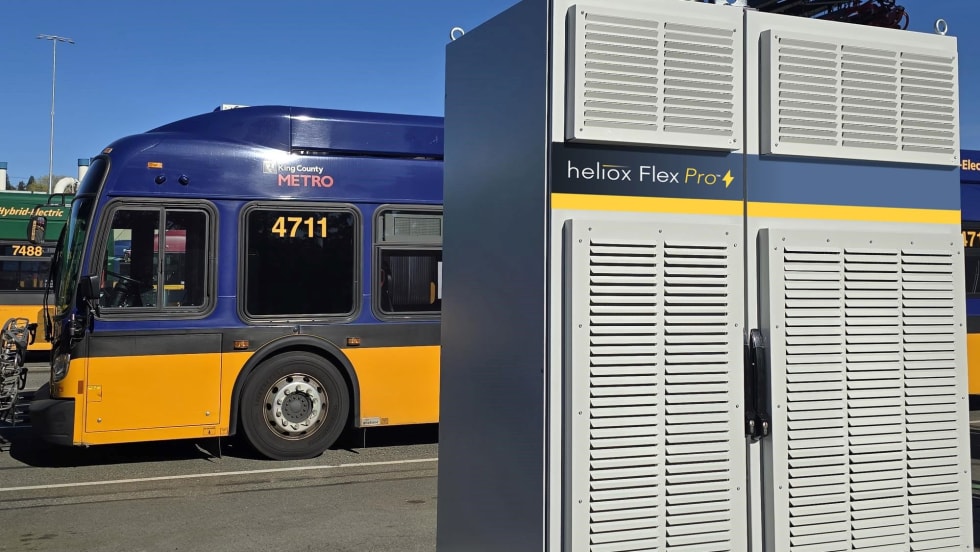
King County Test Heliox Chargers, Keolis Lands California Contract Top Biz Briefs
Stay informed with these quick takes on the projects and companies driving progress across the transportation landscape.
Read More →