
Paratransit Survey: Customer Service a Growing Concern
Survey showed demand down slightly from last year, but still high, with nearly two-thirds seeing an increase. More operators reported customer expectations and behavior as hurdles to providing good service. Scheduling software comes in handy and travel training saw a slight bump.

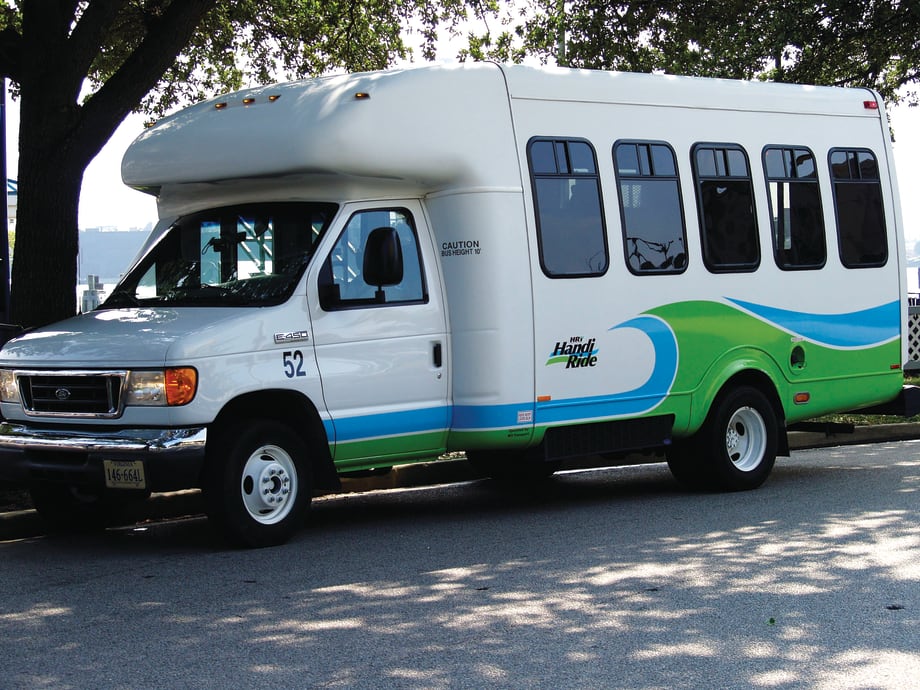
Tampa, Fla.’s Hillsborough Area Regional Transit (HART) cited an 18% increase in ridership and implemented real-time scheduling to handle the uptick. Like many others, HART’s top concern is customer service.
For its ninth annual paratransit survey, capturing a snapshot of the industry, METRO received responses from 88 paratransit providers from 36 states across the U.S. and one system from Canada. Respondents answered 22 questions about their fleets, ridership, concerns and innovations.
Fleet numbers dip
There are a total of 3,851 vehicles represented in this year’s survey results, with the smallest fleet comprised of two vehicles, and the largest fleet coming in at 324 vehicles. The average fleet size is 51 vehicles, down significantly from last year, and the median is 31.
Twenty-six percent of respondents reported having mid- to full-sized vehicles (more than 25 feet in length) in their fleets. Small vehicles made up half of fleets, a sizable decrease from the 69% reported in last year’s survey. A breakdown of bus sizes for all fleets can be found in Figure 1 (see page 18). Vans accounted for 17% of all fleets, which is about the same as the total reported in our 2011 survey, and taxis comprised 6%, continuing a possible downward trend, reflected by the 7% total in 2011 and 9% in 2009.
2013 purchases
Slightly more than half of operators surveyed plan to buy new vehicles next year, up a bit from last year’s 48%. The total number of vehicles on order is 514. Nearly one-third of respondents do not plan to purchase vehicles in 2013 (Figure 2), and no carriers reported plans to procure more than 100 vehicles in the upcoming fiscal year, signifying a small increase from last year’s 44%, without plans to buy more vehicles.
Ridership still growing
Sixty-three percent of operators cited an increase in their 2011 ridership numbers, averaging 8%, while 37% responded with decreases, which averaged at 5% (Figure 3). While the increase reported is down by a hair from last year’s 66%, the trend of increasing demand continues, as was made clear in many of the write-in responses we received. No respondents reported ridership staying the same from 2010 to 2011. Four operators stood out with significantly high increases, ranging from 30% to 73%.
Scheduling technology
As with last year, the majority of carriers, at 57%, claimed they did not utilize any new technology in 2011. Nearly one-fifth of operators implemented scheduling and dispatch software to more efficiently meet rising demand and improve productivity. One operator, Davenport, Iowa-based River Bend Transit, even created a separate staff position devoted entirely to scheduling trips. A handful of providers chose automatic vehicle location and to upgrade their IVR/call systems.
Additionally, respondents cited investing in cost accounting software, accepting online reservations and taxi swipe card technology.[PAGEBREAK]
Productivity and billing
The most common response, at 74%, for calculating productivity, among both those operators using contractors and those that don’t, was the use of a passengers-per-revenue-hour formula. Carriers that bill per hour average 2.16 passengers, about the same as last year’s 2.12. Twelve respondents commented that productivity is tracked by total vehicle hours, and only one carrier claimed to not track productivity.
Regarding billing, slightly more than half of respondents reported using contractors, with 70% billing per hour and 30% billing per trip.
Denials and reporting
Eighty percent of operators surveyed responded to the question, “Do you require in-person interviews in order to become certified?” Half of respondents do not require in-person interviews. The rate of denial decisions averaged approximately 4%. More than two-thirds of carriers report trip denials, and only one percent do not have a denial policy.
No-Shows
Up slightly from last year, 92% of operators responded that they have a “No-Show” policy, 2% do not have a policy on no-shows but are considering one, and 5% do not have a “No-Show” policy and are not considering implementing one.
Operators that either have the policy in place or are looking into it commented that the policy helps cuts costs, keeping the no-show and last-minute cancellation rate low, and improve service. One carrier only recently began enforcing its “No-Show” policy.
Travel training
Fifty-seven percent of respondents reported having a travel training program in place, slightly more than last year, and 16% are planning to create one.
Reasons for having the program included easing demand on the paratransit system by shifting some riders to fixed routes, improving customer service and having a small service area. “Some ADA passengers can and are willing to ride the fixed-route buses if the buses are handicap-accessible and if they know how and where to catch the bus,” Tanya Fleming, paratransit coordinator of Pine Bluff, Ark.’s Pine Bluff Transit says.
Providers that are looking to implement a program cited long-term cost savings and more freedom for their riders. A few providers said they do not have formal travel training programs, but either have one staff member on hand to offer travel assistance or do training sessions at senior centers. Additionally, Providence, R.I.-based Rhode Island Public Transit Authority is partnering with community-based agencies that are providing travel training and working to develop a common statewide curriculum and train-the-trainer course, with materials and assistance for the travel trainers. When asked why their agency was considering starting a travel training program, one operator simply said, “Everything helps.”
The most-cited obstacle to offering the program is cost.
Challenges and concerns
Once again, the biggest challenge operators are facing is funding. Forty-one percent cited this as their primary hurdle to providing service, and nearly every respondent who listed money as a difficulty linked it with demand, which was the second-highest ranked challenge at 32%. Those two challenges were linked almost exclusively with customer service as the top concern for 37% of respondents, a new development from previous surveys.
While last year’s responses regarding challenges centered on drivers being expected to provide more assistance to customers, responses this time around were focused not only on the expectations of customers, but of their behavior as well. Many operators made comments indicating that they had difficulties with customers not being ready on time to be picked up or having different expectations of the service, “not understanding what Shared Ride is,” as one provider put it. Dealing with Medicaid was also listed as getting more difficult.
Other challenges operators are dealing with include environment (7%) staff performance (6%) and ADA enforcement (5%).
Finding and keeping the people right for the job were second- and third-place concerns that underscored the top worry over providing good customer service. One-quarter of carriers listed recruiting, and retention and training came in at 22%. (Figure 8). Other concerns included injury (15%), safety (1%) and absenteeism (1%).
To view the entire article with charts and graphs, click here.
More Paratransit

METRO Magazine Announces 2026 Innovative Solutions Awards Winners
Projects Recognized for Advancing Mobility Through Technology, Accessibility, Workforce Innovation, and Operational Excellence
Read More →Biz Briefs: STV teams with Amtrak, Motorcoach Operators Boost Fleet and Land Contracts, and More
From manufacturers and suppliers to transit agencies and motorcoach operators, these updates offer a snapshot of the projects, partnerships and business moves driving the industry forward.
Read More →
Biz Briefs: Masabi Teams with St. Louis Metro and More
In METRO's latest installment, we take a look at recent news from Transdev, Hitachi, and more partnerships making headlines across the transportation sector.
Read More →
New York MTA Leverages Zoning Program to Advance Station Accessibility
Accessibility enhancements at Nevins St Station will be financed through a development agreement tied to the MTA's Zoning for Accessibility initiative.
Read More →
Reinventing Fleet Maintenance with Real-time Visibility and AI
Transit leaders need to know what needs fixing, where to look, who is responsible, when work is completed, and what it costs without having to chase information across disconnected systems.
Read More →
SamTrans Sets Priorities for Potential Connect Bay Area Revenue
The board-approved framework allocates future funding to maintaining service, rider improvements, equity initiatives, and infrastructure repairs.
Read More →
Chicago's NITA Act Moves Into Next Phase as Service Improvements Begin
Rider-focused improvements will begin rolling out across the system immediately as CTA, Metra, and Pace increase service this summer in the six-county region.
Read More →
2026 METRO Buyer’s Guide & Directory
Searching for the right vehicles, technology, equipment, or services for your public transit or motorcoach operation? This industry guide brings together manufacturers and suppliers from across the transportation market — all in one place. Download it to connect with the companies that help agencies and operators improve mobility, enhance operations, and move their organizations forward.
Read More →
Rays the Mark Foundation to Honor CDTA’s Emily DeVito at October Fundraiser
Event at Chicago-area Ravisloe Country Club will support DeVito, a transit employee and mother of twins battling kidney failure and awaiting a transplant.
Read More →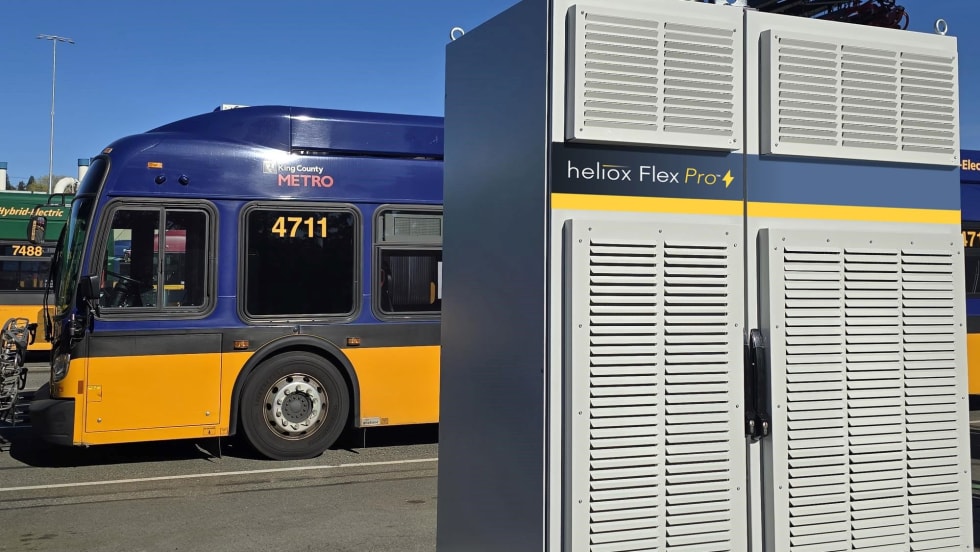
King County Test Heliox Chargers, Keolis Lands California Contract Top Biz Briefs
Stay informed with these quick takes on the projects and companies driving progress across the transportation landscape.
Read More →