
NY MTA unveils 'first-of-its-kind' bus performance dashboard
The data on the bus performance dashboard is based on farebox, GPS, and other information and can be filtered by borough; types of service, such as local/limited, express, or Select Bus Service; and time periods, such as weekday peak or off-peak hours.

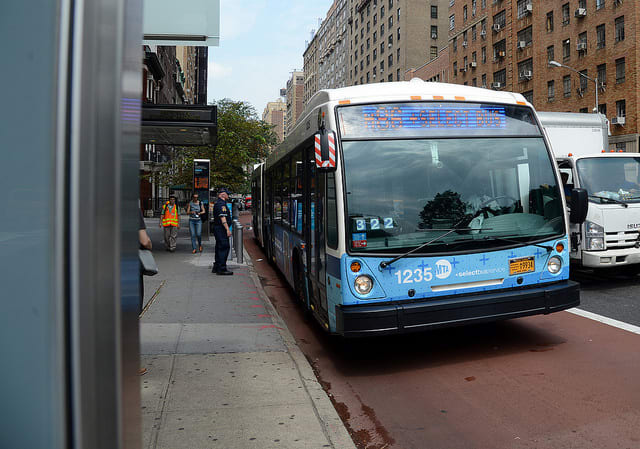
MTA New York City Transit President Andy Byford cited improvements to bus service in all five boroughs as one of his top four goals when he started his position in January.
Marc A. Hermann
The New York Metropolitan Transportation Authority (MTA) launched a new online dashboard detailing customer-focused performance metrics for bus routes as part of MTA New York City Transit’s strategy to improve service across the city’s bus network.
The data on the bus performance dashboard is based on farebox, GPS, and other information and can be filtered by borough; types of service, such as local/limited, express, or Select Bus Service; and time periods, such as weekday peak or off-peak hours. No other transit system in the world is considered to provide the same level of detail in an online dashboard.
MTA New York City Transit President Andy Byford cited improvements to bus service in all five boroughs as one of his top four goals when he started his position in January. Although service reliability for buses is largely dependent upon road conditions and traffic law enforcement, NYC Transit is committed to making improvements to its fleet, safety, service management, customer amenities, transparency, and customer service, as well as working with city government and community partners to make routes more efficient.
“Good bus service is critical to millions of New Yorkers and this new dashboard gives both customers and MTA management a good idea of the service we have now and how to improve it,” said MTA Managing Director Veronique “Ronnie” Hakim.
“When I came to New York City Transit, I immediately recognized the importance of bus service because millions of our customers rely on buses as a viable mode of transportation, and New York City presents one of the largest and most challenging bus operating environments in the world,” said New York City Transit President Andy Byford. “While we look to our partners in City government to help address congestion and traffic enforcement, we are doing everything we can to improve the performance and transparency of our system. This new tool will help us measure and track the customer experience in meaningful ways that will help lead to improvements in the system.”
The dashboard is live now at http://busdashboard.mta.info/ and displays data on multiple metrics including:
Average bus speeds (new metric).
The average time customers wait at bus stops longer than scheduled (new metric).
The average time customers spend on trips longer than scheduled (new metric).
The percentage of customers whose trips are completed on time (new metric).
Percentage of service delivered vs service scheduled.
Mean distance between bus equipment failures.
Passenger environment quality.
More Bus
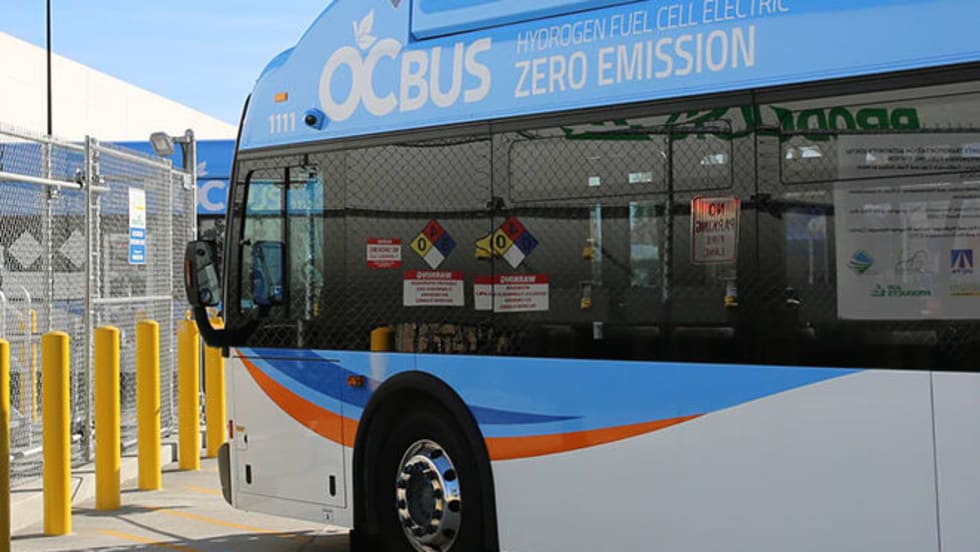
Biz Briefs: OCTA Taps Clean Energy for Hydrogen Station, Stadler to Supply Via Rail Vehicles, and More
From manufacturers and suppliers to transit agencies and motorcoach operators, these updates offer a snapshot of the projects, partnerships and business moves driving the industry forward.
Read More →
METRO Magazine Announces 2026 Innovative Solutions Awards Winners
Projects Recognized for Advancing Mobility Through Technology, Accessibility, Workforce Innovation, and Operational Excellence
Read More →Biz Briefs: STV teams with Amtrak, Motorcoach Operators Boost Fleet and Land Contracts, and More
From manufacturers and suppliers to transit agencies and motorcoach operators, these updates offer a snapshot of the projects, partnerships and business moves driving the industry forward.
Read More →
LA Metro Marks Banner Year, Sets Ambitious Goals for New Fiscal Year
Incoming LA Metro Board Chair and Los Angeles Mayor Karen Bass joined outgoing Board Chair Fernando Dutra and LA Metro CEO Stephanie Wiggins to review accomplishments from fiscal year 2026, which included the opening of new rail extensions, advancement of major transit projects, expanded safety programs, and new rider amenities.
Read More →
DART Taps Nathaniel P. Ford Sr. as Next President/CEO
Since 2012, Ford has served as the CEO of the Jacksonville Transportation Authority
Read More →
AC Transit’s Cecil Blandon on Building the Next Generation of Transit Maintenance Leaders
The agency’s maintenance chief discusses leadership, workforce development, zero-emission technology, and preparing technicians for the future of public transportation.
Read More →
Building the Next Generation of Transit Technology
In this edition of METROspectives, Luminator CEO Magnus Friberg discusses the company's transformation, the growing role of AI and software, and what's next for transit technology.
Read More →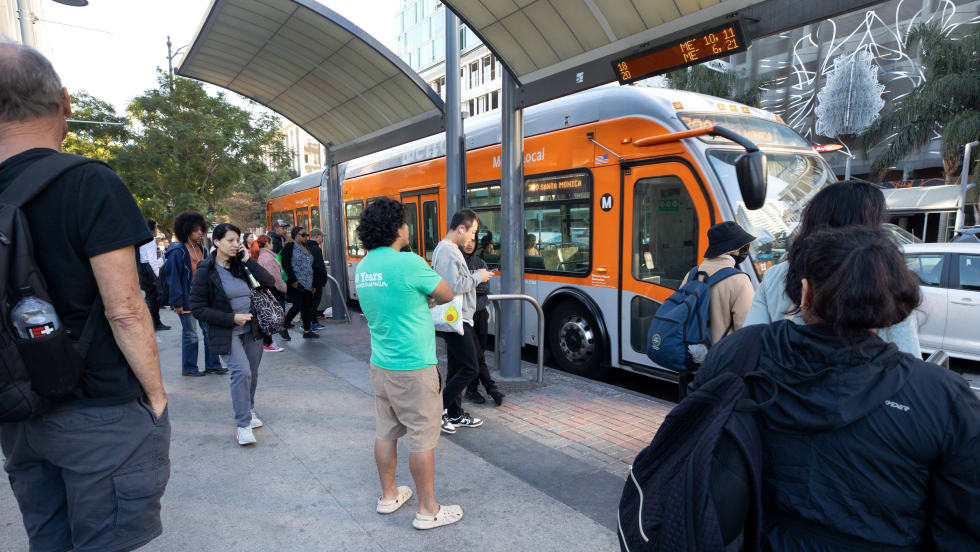
June LA Metro Ridership Surges 2 Million Year Over Year
Total June ridership increased for both weekdays and weekends. Weekday ridership was 953,820, which grew 8.4% from June 2025; Saturdays increased nearly 13% year-over-year to 708,826; and Sundays increased 7.7% to 611,534 from June 2025, according to LA Metro.
Read More →
Washington's Pierce Transit Board Sends Transit Funding Measure to November Ballot
With the adoption of Resolution 2026-006, the measure moves to the Pierce County Auditor, giving voters in the Pierce Transit service area the decision on whether to fund an expansion of local transit service within the agency’s service area.
Read More →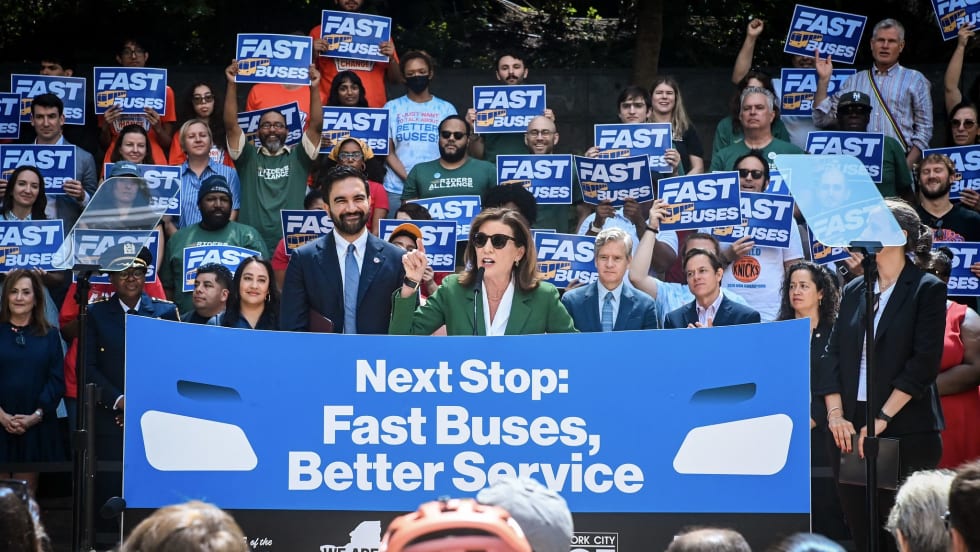
New York Unveils Sweeping Plan to Modernize City Bus Service
Next Stop: Fast Buses, Better Service identifies 50 priority bus corridors for improvements across the five boroughs and launches the City’s next generation of rapid bus service along five key routes.
Read More →