
Largest-ever transit data comparison tool unveiled
AllTransit aggregates information from over 543,000 transit stops, 800 transit agencies and 15,000 routes nationwide to help communities build smarter, more equitable transit systems.


AllTransit screenshot of transit in New York City.
The Center for Neighborhood Technology (CNT) and TransitCenter unveiled a first-of-its-kind interactive online tool to help people understand the value of transit in their communities.
AllTransit aggregates information from over 543,000 transit stops, 800 transit agencies and 15,000 routes nationwide — a collection of data of unprecedented breadth about transit connectivity, access and frequency. The tool not only provides a better understanding of the quality of transit service, but goes a step further by assessing how access to public transportation affects health, equity and economic development.
“Using AllTransit, transit advocates will be able to find data and statistics to support advocacy efforts with greater ease than ever before. Planners can quickly examine where transit is lacking in their communities. Small-business owners can visualize the impact of transit on their customers. And, journalists will have a simple, fast way to access transit data to inform their reporting,” said Scott Bernstein, president of the Center for Neighborhood Technology.
AllTransit also introduces a dynamic new way to measure the quality of transit: the AllTransit Performance Score, which combines data on connectivity, job access, frequency of service and commuting habits. The result is the most comprehensive assessment of transit quality at the local level than has ever been available to the public, according to CNT.
“AllTransit offers tremendous potential to increase our understanding of the value that high-quality transit provides American communities, by visualizing transit’s impact on job access, economic development, urban mobility, and social equity outcomes,” said David Bragdon, executive director of TransitCenter.
More Management
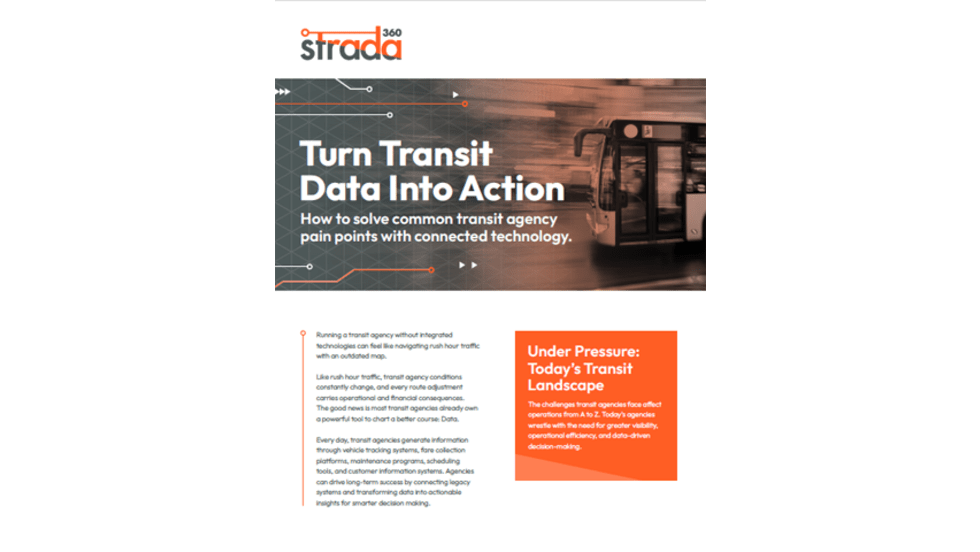
Turn Transit Data Into Action
Discover how leading agencies are using connected technology to gain real-time visibility across operations, improve service reliability, and reduce disruptions.
Read More →
What Transit-Oriented Development Means for the Future of Public Transportation
Once viewed primarily as transit operators, agencies are now leveraging land, partnerships, and long-term planning to boost ridership, expand housing, and strengthen communities.
Read More →
USDOT Announces $22 Million for Transit Innovation, Updates High-Speed Rail Rules
New federal transit funding will support safety, accessibility, and technology projects as updated rail regulations establish new noise standards for high-speed trains.
Read More →
Transportation Construction Coalition Unveils Infrastructure Case Studies Ahead of Federal Funding Deadline
The coalition noted the next surface transportation bill should provide sustained investment in highways and public transit to strengthen freight movement, improve safety, and support economic growth.
Read More →
People Movement: American Bus Association Extends Ferguson and More
METRO’s People Movement highlights the latest leadership changes, promotions, and personnel news across the public transit, motorcoach, and people mobility sectors.
Read More →
METRO Magazine Announces 2026 Innovative Solutions Awards Winners
Projects Recognized for Advancing Mobility Through Technology, Accessibility, Workforce Innovation, and Operational Excellence
Read More →
MBTA Rolls Out Pilot Programs to Cut Costs, Simplify Travel
Three new fare pilots — including unlimited two-hour transfers, reduced express bus fares, and free transit for eligible seniors — will launch this fall as Massachusetts extends popular commuter rail discounts through November.
Read More →
FTA Opens $610 Million Funding Opportunity for Bus Infrastructure Projects
The latest Notice of Funding Opportunity provides transit agencies with funding for bus facilities, fleet modernization, and low- and no-emission vehicles, with applications due September 21.
Read More →Biz Briefs: STV teams with Amtrak, Motorcoach Operators Boost Fleet and Land Contracts, and More
From manufacturers and suppliers to transit agencies and motorcoach operators, these updates offer a snapshot of the projects, partnerships and business moves driving the industry forward.
Read More →
Massachusetts Approves $530M to Strengthen MBTA Operations, Infrastructure
The funding package targets operating stability, capital improvements, and fare affordability, offering a model for agencies navigating long-term funding challenges.
Read More →