
NY MTA buses lost 100 million passenger trips since 2008, report says
The average New York City Transit bus travels 7.4 miles per hour along its local, SBS, and express routes — slowest among the seventeen largest bus companies in the nation, according to a city comptroller report.

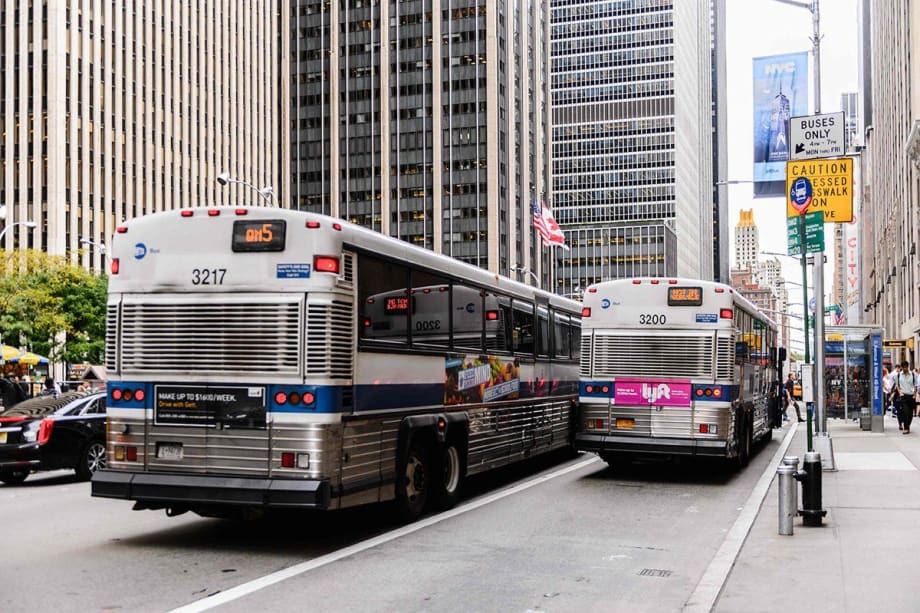
The size and scope of New York City’s bus system is unparalleled, with 5,700 buses, 330 routes, and 15,000-plus stops serving well over two million passengers each day. Photo: Anton Ivanov/Shutterstock.com

In the last eight years, the MTA bus system lost 100 million passenger trips while buses traveled at the slowest speeds in the country among large cities, according to a new report released today by New York City Comptroller Scott M. Stringer. The decline in ridership is not surprising, given routes that are often slow, unreliable, long, meandering, confusing, congested, and poorly connected, according to the Comptroller’s report, The Other Transit Crisis: How to Improve NYC’s Bus System. The report also found that the rapid decline in New York City’s bus service over the last decade disproportionately impacts immigrant and lower-income New Yorkers, since they make up the highest share of city bus riders.
The size and scope of New York City’s bus system is unparalleled, with 5,700 buses, 330 routes, and 15,000-plus stops serving well over two million passengers each day — more than the combined daily ridership of LIRR, MetroNorth, PATH, and New Jersey Transit. Yet, Comptroller Stringer’s analysis shows alarming deterioration.
MTA buses are now the slowest in the nation among large cities. In fact, bus service can often be slower than walking speed.
The average New York City Transit bus travels 7.4 miles per hour along its local, SBS, and express routes — slowest among the seventeen largest bus companies in the nation, according to the report.
The typical New York City bus spends only half its time in-motion/in-traffic. Another 21 percent is spent at red lights and 22 percent at bus stops.
Average bus speeds vary dramatically among the boroughs, with the slowest average speeds in Manhattan (5.5mph), Brooklyn (6.3mph), and the Bronx (6.5mph). This is significantly lower than local routes in Queens (8.1mph) and Staten Island (11.4mph).
As service has deteriorated, ridership has plummeted.
The MTA bus system has lost 100 million passenger trips in the last eight years. That decline is most prevalent in Manhattan, where ridership is down 16 percent since 2011, and Brooklyn, which has seen a four percent decline over the same time period.
MTA Bus Ridership, 2006-2016
This decline is happening at a time when NYC’s economy – and commuting patterns – are changing, with increased job growth outside of Manhattan that necessitates new routes.
NYC subways were largely built to bring workers to Manhattan. But residents of every borough are now more likely to commute within their home borough rather than to Manhattan, making an efficient, well-planned bus system even more important.
From 2006 to 2016, the number of jobs located in Brooklyn jumped by 49 percent, in the Bronx by 35 percent, in Queens by 34 percent, and in Staten Island by 27 percent — but only 5 percent in Manhattan. As a result, the share of New York City jobs located outside of Manhattan rose from 35 percent to 42 percent over this period.
The changing jobs geography means residents of every borough are now more likely to commute within their home borough than to
As new employment centers emerge outside of Manhattan, the bus system has not kept pace.
As new employment centers emerge outside of Manhattan, the bus system has not kept pace. Compared to the average city neighborhood, in total there are 12 neighborhoods (and two airports) that offer significantly more jobs but remain significantly underserved by bus and subway service.
Neighborhoods like Williamsburg, Morris Park, Norwood, Greenpoint, Glen Oaks, Red Hook, and the two Queens airports are among the top neighborhoods that remain underserved by a declining bus system.
Bus commuters are diverse and tend to be lower income than the City generally.
The average personal income of bus commuters is $28,455 — far lower than subway commuters and employed New Yorkers as a whole.
55 percent of bus riders are foreign born, and 75 percent are New Yorkers of color.
Table 1: Profile of New York City Commuters
Bus Commuters Subway Commuters All New Yorkers Median Income (of employed) $28,455 $40,000 $38,840 Bachelor’s Degree or Higher (Age 25+) 31% 48% 36% Share of Working Population that is age 60+ 12% 8% 10% Parent (age 16+) with Children at Home 42% 33% 36% Single Parent (age 16+) 17% 10% 12% Foreign Born 55% 49% 41% Person of Color 75% 66% 67% Work in Healthcare, Hospitality, Retail, Food Services, or Cultural industries 49% 38% 38%
United States Census Bureau. American Community Survey 2011-2015 5-Year Estimates.
Long and meandering bus routes occur because the MTA often fails to follow its own design standards, schedules, and protocols.
In order to keep buses moving, the MTA aims to locate bus stops at least 750 feet apart. This “stop-spacing” standard is very low compared to other major cities, and yet it is applied very loosely by the MTA. On ten routes, for instance, bus stops are spaced more than 1,200 feet apart, or nearly double the standard, which can make access difficult for seniors and the disabled. Meanwhile, 30 percent of routes do not maintain even this minimum standard. In fact, among Manhattan bus routes, the average distance between bus stops is 757 feet, barely higher than the recommended minimum.
The MTA has expressly acknowledged that long and meandering bus routes are inefficient and unreliable. Yet bus routes remain highly circuitous, with over 38 making at least 15 turns and the average Staten Island route making 13. City-wide, the average local route is 6.8 miles long and in Staten Island, 10.6 miles.
Based on the MTA’s own 12-year replacement cycle for buses, the average age of vehicles should be 6 years. In fact, the average age of an MTA bus is 7.8 years, and 22 percent are still on the road after a dozen years.
NYC’s bus system is also hampered by a fractured management structure that needs to be better coordinated.
The bus system’s management is divided between two agencies: New York City Transit Bus and the MTA Bus Company.
The operating costs per passenger for the NYCT Bus ($3.98) and MTA Bus Company ($5.48) ranked them 7th and 14th among the 17 largest city bus companies in the United States.
Both the MTA and City DOT have struggled to implement new technologies and core amenities that could improve the speed and reliability of bus service, including Select Bus Service (SBS) and Transit Signal Priority (TSP).
To improve the City’s bus system, Comptroller Stringer’s report calls for a series of reforms, including a comprehensive review of the bus network to better align with new job centers and changing neighborhood demographics, and enhanced coordination between the MTA and City DOT. Comptroller Stringer is calling on the City and the MTA to do the following:
The MTA Bus Company and New York Transit Bus should better coordinate their operations, particularly scheduling, planning, and depot divisions, to increase efficiency and better serve riders.
In consultation with surrounding neighborhoods, the MTA, DOT, and Department of City Planning should initiate a comprehensive review of the bus network to better align with changing commuting patterns, as other cities like Houston, Baltimore, and Portland have already accomplished.
In consultation with surrounding neighborhoods, the MTA should review stop-spacing on all of its routes and reform its stop-spacing guidelines to better balance the speed, reliability and accessibility of its bus routes.
The MTA should increase the frequency of buses in “off-peak” hours and overhaul its scheduling guidelines in order to better service the rapid growth of the health, hospitality, retail, food services, and cultural sectors.
The DOT and MTA should improve coordination and expedite the implementation of Transit Signal Priority along bus routes.
The DOT should improve the maintenance, enforcement, and design of bus lanes and place greater emphasis on bus lanes outside of SBS corridors.
More Management

Federal Railroad Administration Study Finds Upgrades Could Boost Penn Station Capacity by One-Third
The study outlines a roadmap for increasing train throughput while preparing Penn Station for future growth across the Northeast Corridor.
Read More →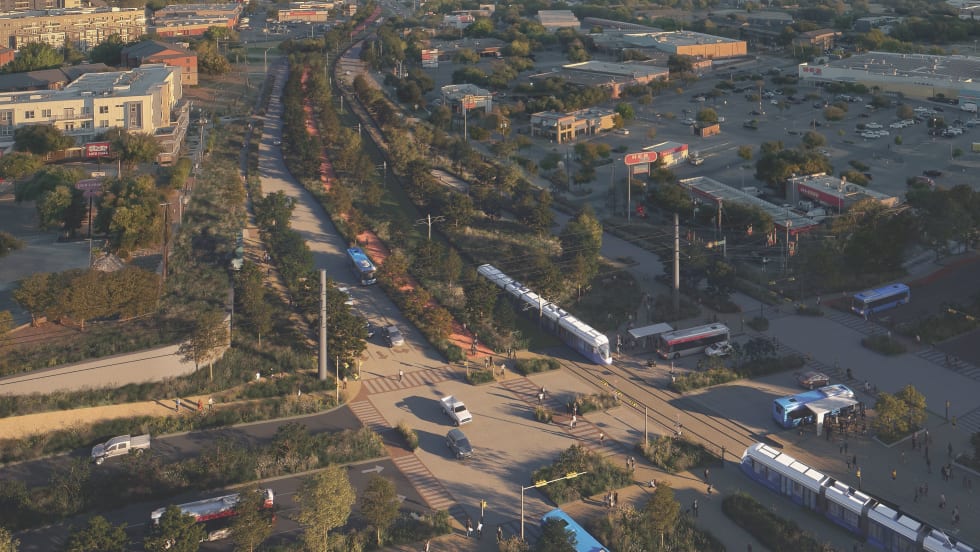
Austin Transit Partnership Selects Stadler to Manufacture Light Rail Vehicles
The award marks the conclusion of a series of major procurements over 18 months, as outlined in ATP’s delivery plan, and keeps Austin Light Rail on track.
Read More →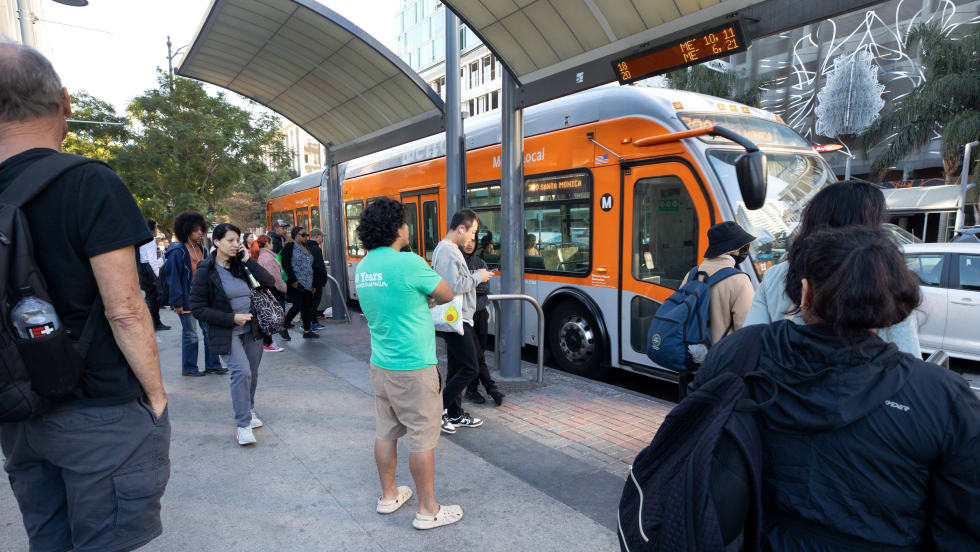
June LA Metro Ridership Surges 2 Million Year Over Year
Total June ridership increased for both weekdays and weekends. Weekday ridership was 953,820, which grew 8.4% from June 2025; Saturdays increased nearly 13% year-over-year to 708,826; and Sundays increased 7.7% to 611,534 from June 2025, according to LA Metro.
Read More →
Washington's Pierce Transit Board Sends Transit Funding Measure to November Ballot
With the adoption of Resolution 2026-006, the measure moves to the Pierce County Auditor, giving voters in the Pierce Transit service area the decision on whether to fund an expansion of local transit service within the agency’s service area.
Read More →
Building the Next Generation of Transit Technology
In this edition of METROspectives, Luminator CEO Magnus Friberg discusses the company's transformation, the growing role of AI and software, and what's next for transit technology.
Read More →
EPA Proposal to Ease Diesel Emissions Compliance Could Improve Reliability for Motorcoach Operators
The EPA is proposing to remove DEF-related engine derates for new heavy-duty diesel vehicles, a change bus operators say would improve safety and reliability while sparking debate over the future of emissions enforcement.
Read More →
Act Now to Join Rays the Mark Foundation's Annual Golf Tournament, Fundraiser
This year's tournament honors Emily DeVito, a member of the public transportation family whose story has moved colleagues across the industry — and with only a few foursomes remaining, organizers are encouraging companies and individuals to register soon.
Read More →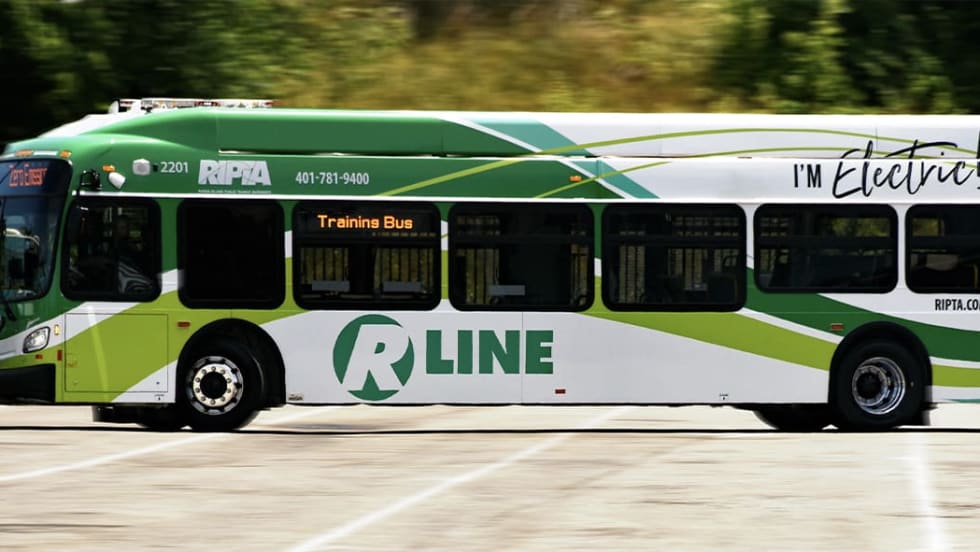
RIPTA Celebrates 60 Years of Public Transit Service
The Rhode Island agency is marking the milestone by highlighting service improvements, mobility initiatives, and its vision for the future of transit.
Read More →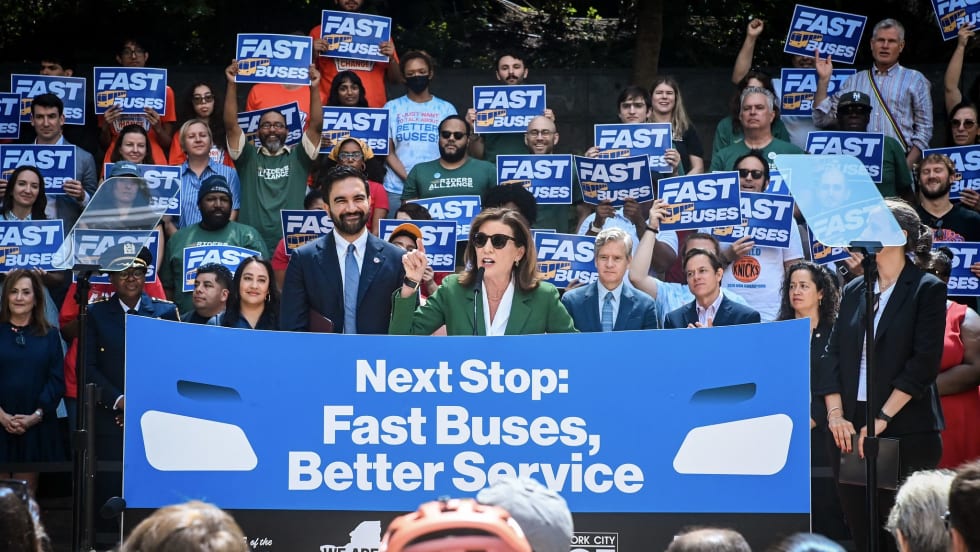
New York Unveils Sweeping Plan to Modernize City Bus Service
Next Stop: Fast Buses, Better Service identifies 50 priority bus corridors for improvements across the five boroughs and launches the City’s next generation of rapid bus service along five key routes.
Read More →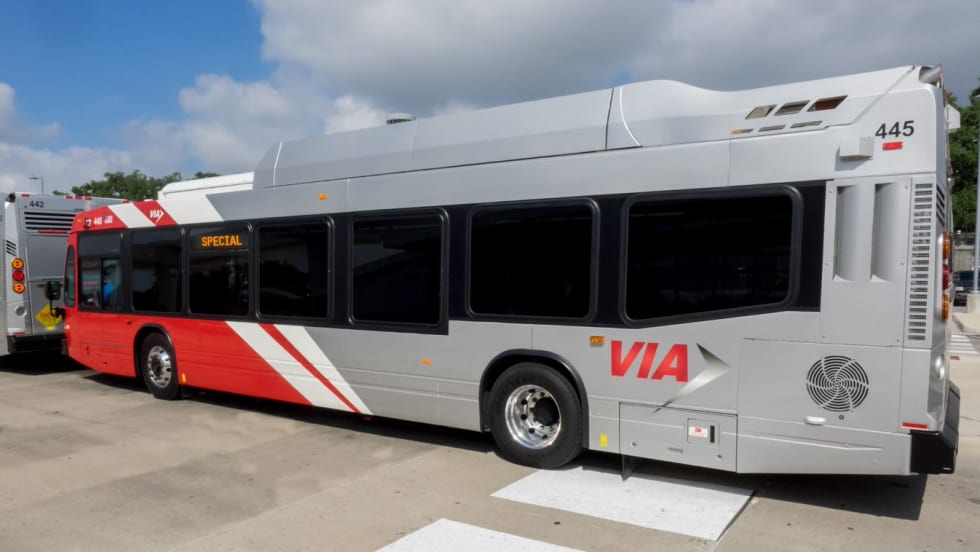
San Antonio's VIA Launches Second Year of Data Fellowship Program
The partnership gives Better Futures Scholars hands-on experience with real-world challenges while providing VIA with additional analytical capacity to support key agency priorities.
Read More →