
Chicago RTA releases Regional Report Card
The recently-released performance measures reports analyzed how the Chicago Transit Authority, Metra and Pace fared in the areas of service coverage, service efficiency and effectiveness, service delivery, service maintenance and capital investment, and service level solvency.

Chicago’s Regional Transportation Authority (RTA) recently released the 2011 Regional Report Card and 2011 Sub-Regional Report which show numerous positive performance measures trends over five years, particularly in the areas of ridership growth and cost effectiveness.
The recently-released performance measures reports analyzed how the Chicago Transit Authority (CTA), Metra and Pace fared in the areas of service coverage, service efficiency and effectiveness, service delivery, service maintenance and capital investment, and service level solvency. Each of these performance areas were impacted by large fluctuations in gasoline prices, rising healthcare costs, and a significant and long-lasting economic recession that produced high levels of unemployment and lowered sales tax revenue, a primary funding source for transit.
In addition, each Service Board implemented strategies to meet the continuing economic challenges, which also affected regional performance.
“Overall, the performance measures report showed positive trends. One key observation, however, was the decrease in funding for the transit system’s capital program. Although all of the transit agencies have implemented cost-cutting measures, addressing the State of Good Repair needs that are estimated at $30 billion remains a challenge,” said Bea Reyna-Hickey, RTA chief financial officer and sr. deputy executive director, finance and performance management.
The following are highlights of the performance measures reports:
Service coverage, which measures how much service is available and used, showed volatility over the last five years. The largest five-year ridership gains were seen by CTA rail (+16.5%) and Pace ADA paratransit (+30.2%). Following two years of ridership declines in 2009 and 2010 related to the economic recession, 2011 saw a 3% increase in system-wide ridership. This increase, combined with longer average trip lengths, resulted in a peak for passenger miles traveled that exceeded four billion miles in 2011. This is particularly notable given the reductions in service coverage that resulted from service cuts implemented by the Service Boards in efforts to reduce operating costs.
Service efficiency and effectiveness measures evaluate the cost of supplying transit services. In 2011, regional operating costs increased by approximately $100 million, a 4.9% increase over 2010 that exceeded the year’s inflation rate. However, the five-year service efficiency and effectiveness measure trends were favorable, with a 7.3% inflation-adjusted reduction in regional operating costs, mostly attributable to service cuts implemented in 2010. That ridership increased the year following significant service cuts indicates that service reductions were strategic and did not negatively impact the transportation needs of the region’s commuters.
Service delivery focuses on the quality of service provided and includes such measures as on-time performance, the rate of safety and security incidents, and for the first time in 2011, results of a customer satisfaction survey. Overall, 83% of customers were satisfied or very satisfied with the services provided by CTA, Metra, and Pace, and 90% percent of the region’s customers indicated that they would recommend regional transit services to others. The rate of safety and security incidents remained very low at 0.086 per 100,000 passenger trips. On-time performance dipped slightly in 2011 but was seven percentage points higher in 2011 compared to 2007.
Service Maintenance and Capital Investment focuses on the physical state of the transit system’s infrastructure. Funding for the 2011 capital program decreased significantly and was 23.4% lower than in 2010. Maintenance expenditures account for 96% of the capital program budget; this share has increased for each of the five years under review and is expected to remain high as capital funding received is less than 10% of what is needed to achieve a State of Good Repair. Current estimates of capital backlog (past due projects and/or vehicle replacements) total $18.5 billion for the Chicagoland region. Despite these overwhelming capital needs, the region’s Service Boards have maintained impressive safety rates and vehicle reliability metrics.
Service Level Solvency evaluates the financial health of the transit system. Overall, fare revenue for 2011 improved for each Service Board and mode with the exception of ADA paratransit, which stayed level with 2010. After factoring for inflation, gains in fare revenue were held to 0.7% for 2011, but grew by 6.3% since 2007. The farebox recovery shortfall (the amount coming from other sources than fares) decreased $0.43 over the past five years, a positive sign indicating a reduced reliance on public funding to cover trip costs.
The RTA’s Regional Performance Measures Reports follow requirements set forth by the 2008 transit reform legislation and recommendations made by the Illinois Auditor General in a 2007 performance and funding audit. The RTA views the reporting as a demonstration of transparency and accountability for transit system stakeholders.
More Bus
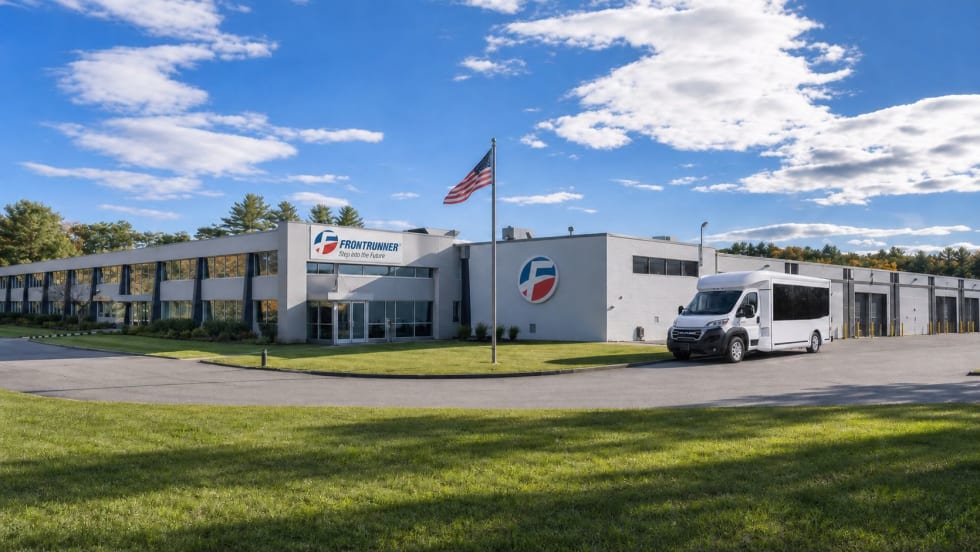
Frontrunner Bus Group Expands with New Massachusetts Headquarters
The significantly larger facility will provide the infrastructure needed to support the company’s growing workforce, advanced technologies, and expanding product line.
Read More →
Joshua Schank on Transportation Innovation, Risk, and the Future of Mobility
In this edition of METROspectives, Joshua Schank discusses lessons from launching LA Metro’s Office of Extraordinary Innovation, the challenges of advancing new mobility technologies, and much more.
Read More →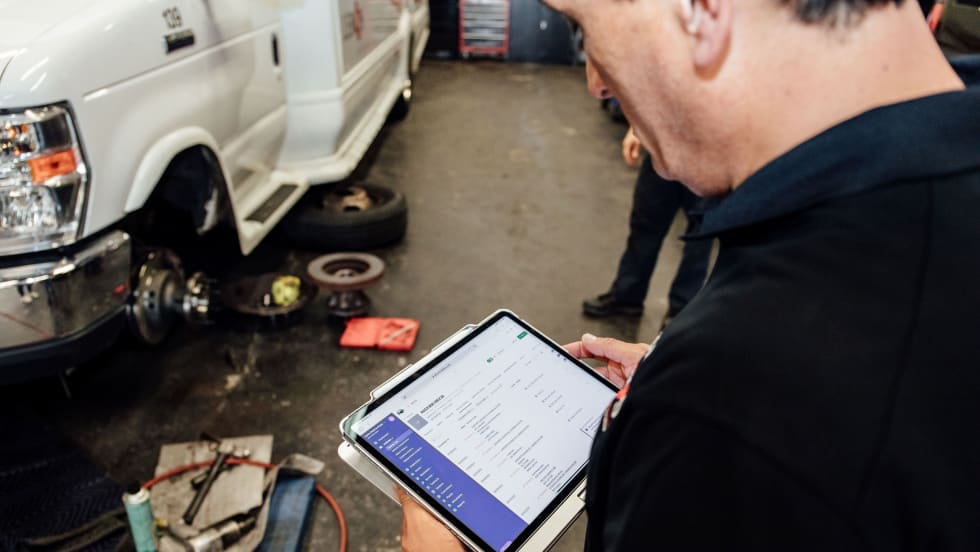
Reinventing Fleet Maintenance with Real-time Visibility and AI
Transit leaders need to know what needs fixing, where to look, who is responsible, when work is completed, and what it costs without having to chase information across disconnected systems.
Read More →
SamTrans Sets Priorities for Potential Connect Bay Area Revenue
The board-approved framework allocates future funding to maintaining service, rider improvements, equity initiatives, and infrastructure repairs.
Read More →
When Routine Fails: How Public Transit Must Adapt for the World Cup
The 2026 FIFA World Cup will test transit agencies’ ability to manage unpredictable travel patterns, making real-time data and operational flexibility critical to moving millions of visitors efficiently.
Read More →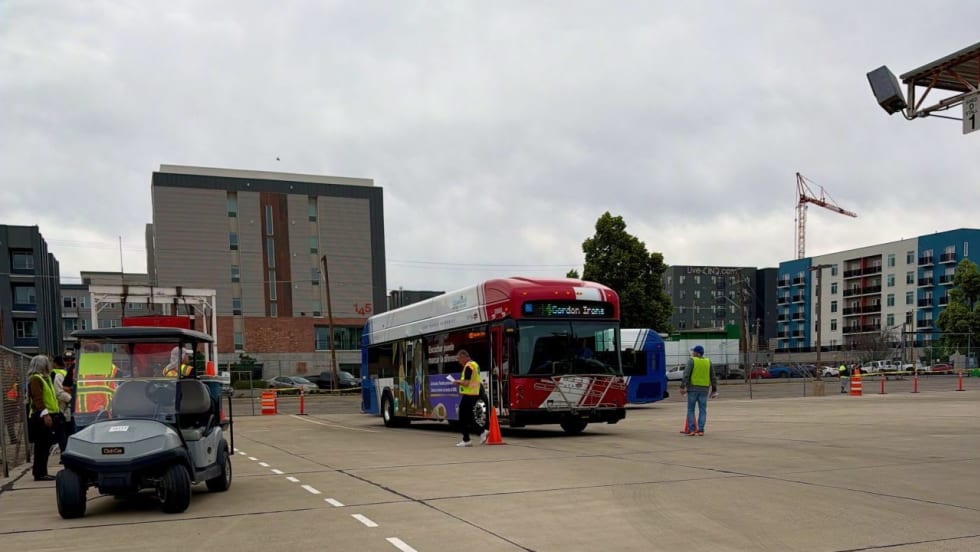
Photo Highlights from APTA's 2026 Mobility Conference
The photo gallery captures scenes from the conference, including the International Bus Roadeo, exhibit hall activities, the Bus Showcase, and much more.
Read More →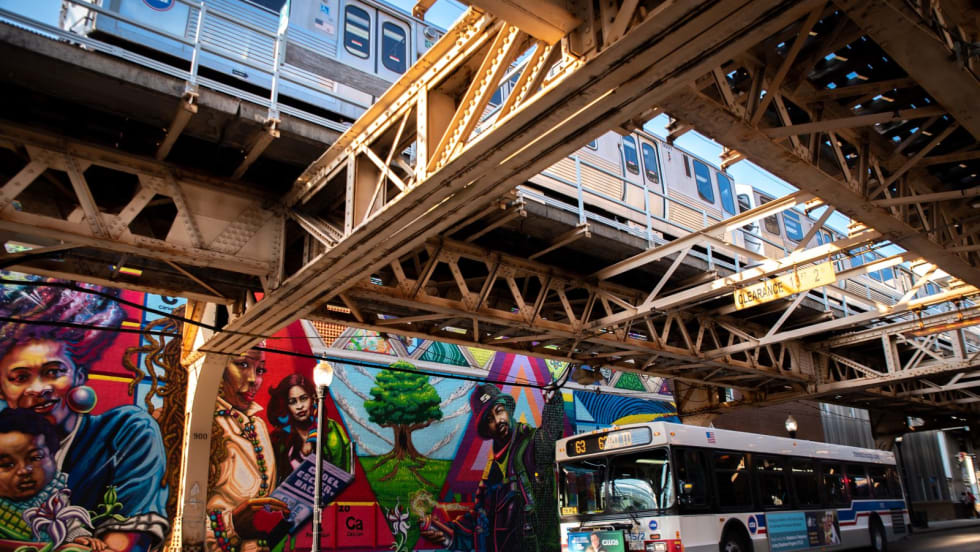
Chicago's NITA Act Moves Into Next Phase as Service Improvements Begin
Rider-focused improvements will begin rolling out across the system immediately as CTA, Metra, and Pace increase service this summer in the six-county region.
Read More →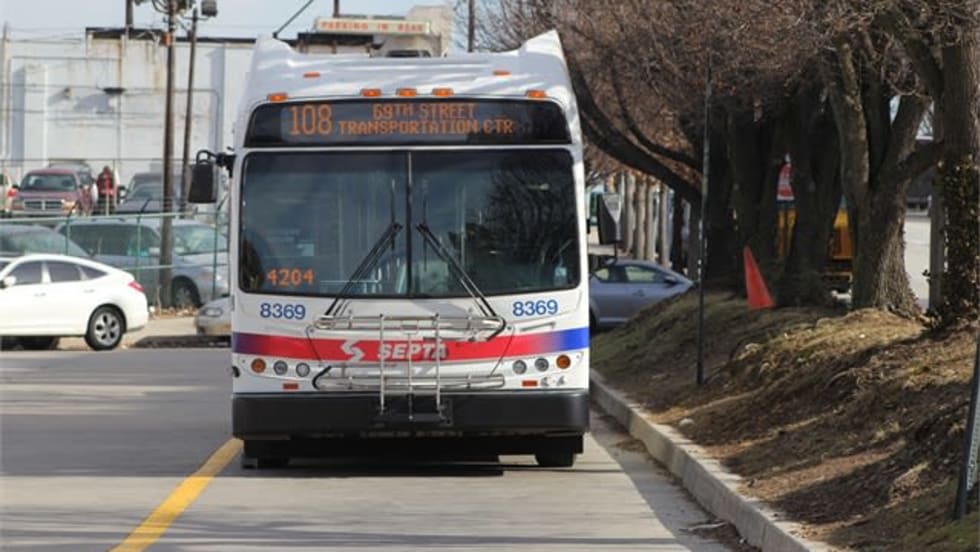
Philadelphia's SEPTA Approves Annual Transit Service Plan
Between 2021 and 2024, SEPTA held more than 200 public meetings — including 144 in-person sessions — throughout the SEPTA service region.
Read More →
A True Low-Floor Minibus Design Delivers Better Accessibility and Efficiency for Everyone
As transit demands evolve, so should your fleet. Download the whitepaper to see how the Low-Floor Frontrunner Minibus compares to traditional options.
Read More →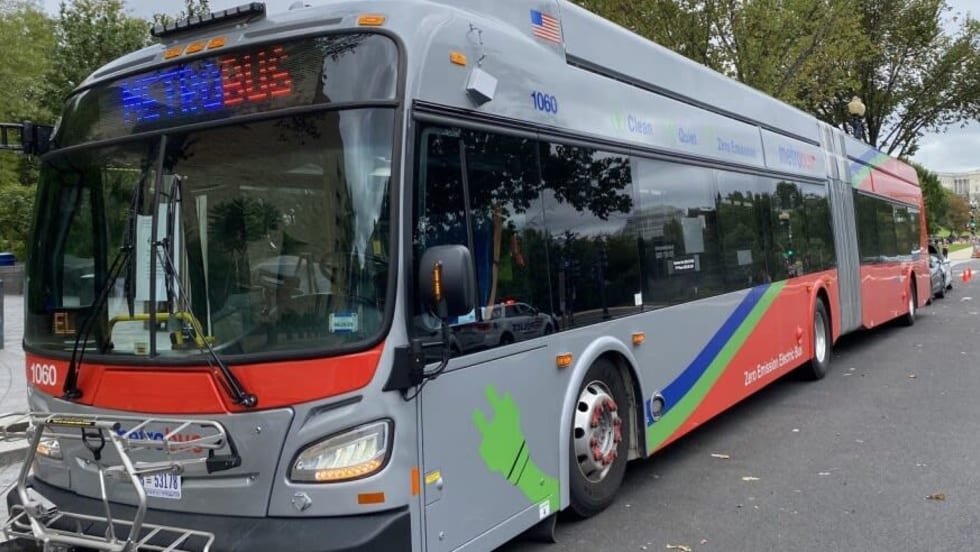
WMATA Debuts 'Fares Pay for Service' Awareness Campaign
The campaign was highlighted during a media event at the Paul S. Sarbanes Transit Center in Silver Spring, where WMATA’s GM/CEO Randy Clarke joined Metro Transit Police officers, WMATA management team, board members, and staff to expand fare enforcement and customer education efforts on Metro Bus routes throughout the region.
Read More →