

RELATED: U. of Minn. study finds transit doesn't improve health
U. of Minn. study ranks accessibility to jobs by transit in top U.S. cities
The findings have a range of uses and implications. State departments of transportation, metropolitan planning organizations, and transit agencies can apply the evaluations to performance goals related to congestion, reliability, and sustainability.
January 9, 2017
IndyGo
3 min to read

New research from the Accessibility Observatory at the University of Minnesota ranks 49 of the 50 largest (by population) metropolitan areas in the U.S. for connecting workers with jobs via transit.
The new rankings, part of the Access Across America study that began in 2013, focus on accessibility, a measure that examines both land use and transportation systems. Accessibility measures how many destinations, such as jobs, can be reached in a given time.
“This project updates our detailed evaluation of access to jobs by transit,” said Andrew Owen, director of the Observatory. “Transit is an essential transportation service for many Americans, and we directly compare the accessibility performance of America’s largest metropolitan areas.”
The findings have a range of uses and implications. State departments of transportation, metropolitan planning organizations, and transit agencies can apply the evaluations to performance goals related to congestion, reliability, and sustainability. In addition, detailed accessibility evaluation can help in selecting between project alternatives and prioritizing investments.
Top 10 metro areas: job accessibility by transit (January 2015)
New York
San Francisco
Chicago
Washington
Los Angeles
Boston
Philadelphia
Seattle
San Jose
Denver
The report — “Access Across America: Transit 2015” — presents detailed accessibility values for each of the 49 metropolitan areas, as well as detailed block-level color maps that illustrate the spatial patterns of accessibility within each area. New analysis of the data from the accessibility to jobs by transit rankings will continue to be published periodically.
The accessibility metrics presented in this report are designed to be comparable to those presented in the Accessibility Observatory’s earlier Access Across America: Auto 2015 report. “Taken together, these reports provide a comprehensive view of the relative accessibility impact of auto and transit systems across different cities,” Owen said.
For example, the Phoenix and Minneapolis–St. Paul metropolitan areas have effectively the same total number of jobs (1.7 million; ranked 13th and 14th respectively), and their auto accessibility rankings are also very close — 13th and 12th. “However, they differ significantly in their transit accessibility rankings: Minneapolis–St. Paul ranks 12th in transit access to jobs, while Phoenix ranks 22nd,” Owen said.
In the study, rankings are determined by a weighted average of accessibility, giving a higher weight to closer, easier-to-access jobs. Jobs reachable within 10 minutes are weighted most heavily; jobs were given decreasing weight as travel time increases up to 60 minutes. Travel times were calculated using detailed pedestrian networks and full transit schedules for the 7 a.m. to 9 a.m. period. The calculations include all components of a transit journey, including “last mile” access and egress walking segments and transfers, and account for minute-by-minute variations in service frequency.
Future comparison reports will track the way that accessibility in these metropolitan areas evolves in response to transportation investments and land-use decisions, Owen explained.
The research was sponsored by the National Accessibility Evaluation Pooled-Fund Study, a multi-year effort led by the Minnesota Department of Transportation and supported by partners including the Federal Highway Administration and 10 state DOTs.
More Bus
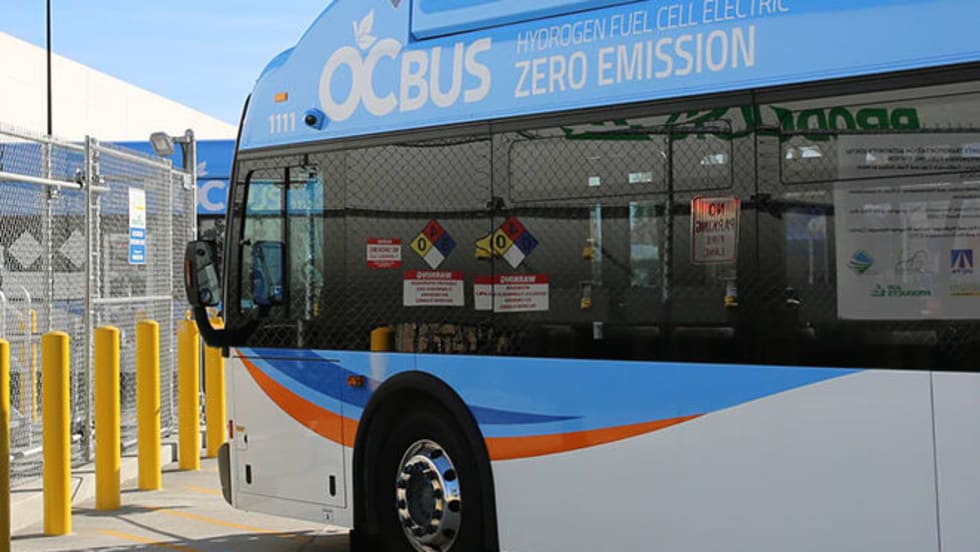
Biz Briefs: OCTA Taps Clean Energy for Hydrogen Station, Stadler to Supply Via Rail Vehicles, and More
From manufacturers and suppliers to transit agencies and motorcoach operators, these updates offer a snapshot of the projects, partnerships and business moves driving the industry forward.
Read More →
METRO Magazine Announces 2026 Innovative Solutions Awards Winners
Projects Recognized for Advancing Mobility Through Technology, Accessibility, Workforce Innovation, and Operational Excellence
Read More →Biz Briefs: STV teams with Amtrak, Motorcoach Operators Boost Fleet and Land Contracts, and More
From manufacturers and suppliers to transit agencies and motorcoach operators, these updates offer a snapshot of the projects, partnerships and business moves driving the industry forward.
Read More →
LA Metro Marks Banner Year, Sets Ambitious Goals for New Fiscal Year
Incoming LA Metro Board Chair and Los Angeles Mayor Karen Bass joined outgoing Board Chair Fernando Dutra and LA Metro CEO Stephanie Wiggins to review accomplishments from fiscal year 2026, which included the opening of new rail extensions, advancement of major transit projects, expanded safety programs, and new rider amenities.
Read More →
DART Taps Nathaniel P. Ford Sr. as Next President/CEO
Since 2012, Ford has served as the CEO of the Jacksonville Transportation Authority
Read More →
AC Transit’s Cecil Blandon on Building the Next Generation of Transit Maintenance Leaders
The agency’s maintenance chief discusses leadership, workforce development, zero-emission technology, and preparing technicians for the future of public transportation.
Read More →
Building the Next Generation of Transit Technology
In this edition of METROspectives, Luminator CEO Magnus Friberg discusses the company's transformation, the growing role of AI and software, and what's next for transit technology.
Read More →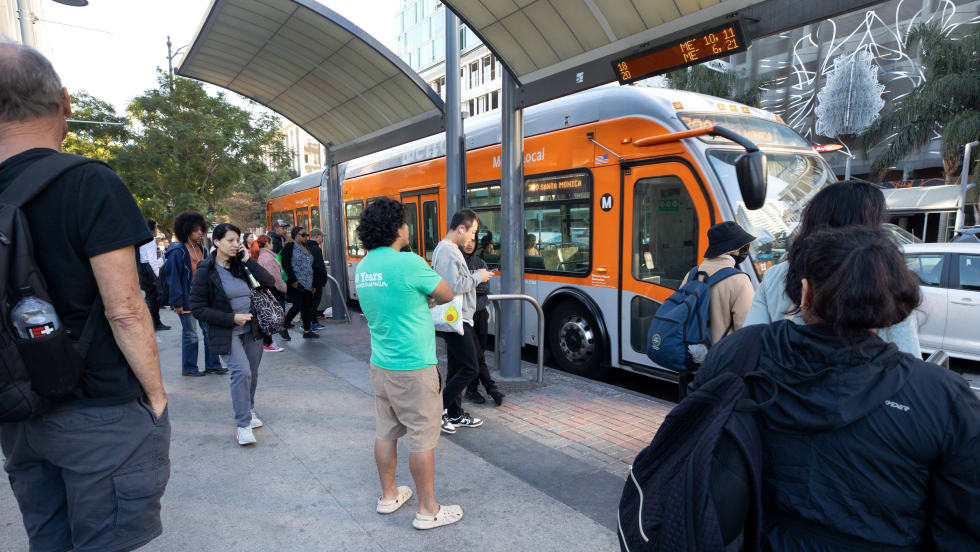
June LA Metro Ridership Surges 2 Million Year Over Year
Total June ridership increased for both weekdays and weekends. Weekday ridership was 953,820, which grew 8.4% from June 2025; Saturdays increased nearly 13% year-over-year to 708,826; and Sundays increased 7.7% to 611,534 from June 2025, according to LA Metro.
Read More →
Washington's Pierce Transit Board Sends Transit Funding Measure to November Ballot
With the adoption of Resolution 2026-006, the measure moves to the Pierce County Auditor, giving voters in the Pierce Transit service area the decision on whether to fund an expansion of local transit service within the agency’s service area.
Read More →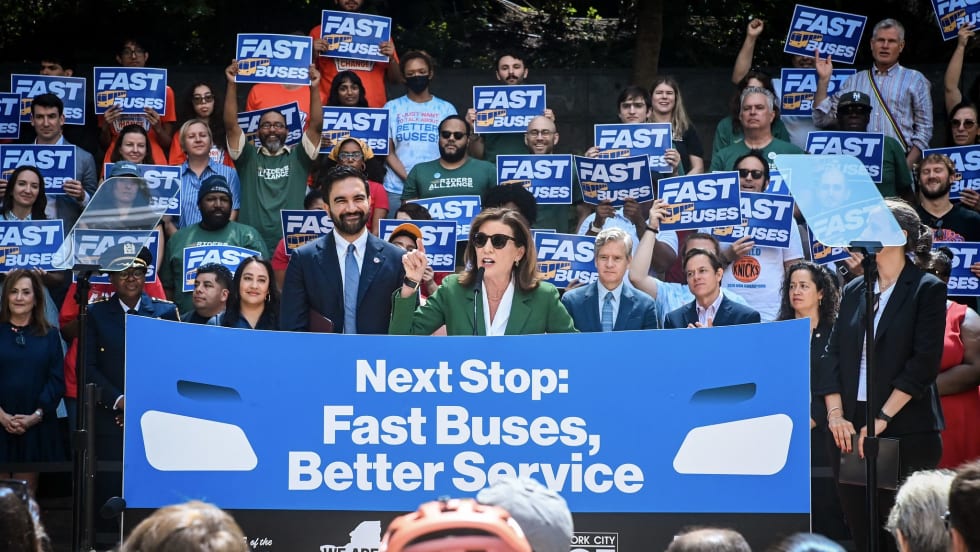
New York Unveils Sweeping Plan to Modernize City Bus Service
Next Stop: Fast Buses, Better Service identifies 50 priority bus corridors for improvements across the five boroughs and launches the City’s next generation of rapid bus service along five key routes.
Read More →