

Transit Score Rank of Large U.S. Cities
Rank City Score
1 New York 84.1
2 San Francisco 80.4
3 Boston 74.4
4 Washington, D.C. 70.6
5 Philadelphia 66.8
6 Chicago 64.7
7 Miami 59.4
8 Baltimore 57.8
9 Minneapolis 57.5
10 Seattle 57.0
New York Ranks Best City for Public Transit in 2016
New York's Transit Score ranking by Walk Score increased 2.9 points to 84.1 from 81.2 in the last published ranking in 2014.
December 2, 2015
New York’s Transit Score increased 2.9 points to 84.1 from 81.2 in the last published ranking in 2014.
Photo: Redfin
3 min to read
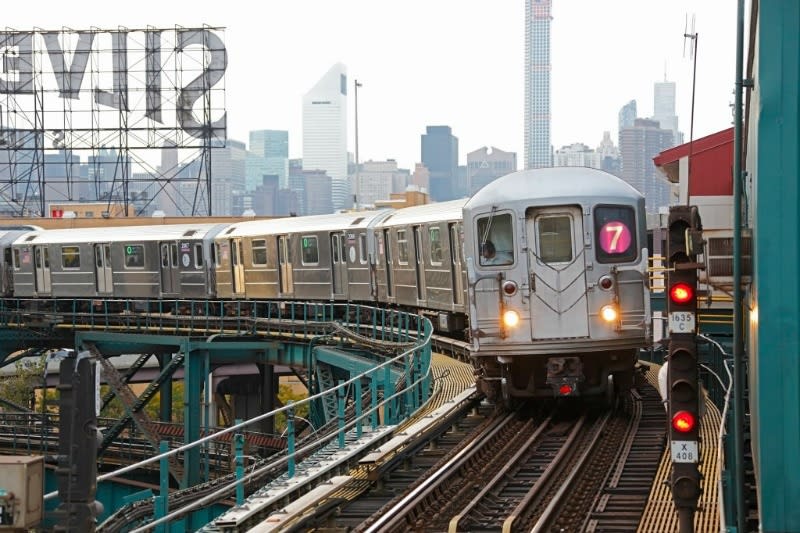
New York is the best U.S. city for public transit, according to Redfin, the real estate brokerage firm. On Dec. 2, Redfin published the 2016 Transit Score ranking by Walk Score, a Redfin company, and announced the expansion of Transit Score ratings to a total of 350 U.S. cities and more than 10,000 neighborhoods.
New York’s Transit Score increased 2.9 points to 84.1 from 81.2 in the last published ranking in 2014. According to Walk Score, a place with a Transit Score in the 70 to 89 range has excellent transit. In September, the Metropolitan Transportation Authority (MTA) celebrated the first addition to its subway system in 26 years, with the extension of the 7 line to the new 34th St.-Hudson Yards Station, connecting riders to the Javits Center, the High Line, the Hudson River Park and surrounding commercial and residential developments.
Below is a ranking of the top 10 U.S. cities (with populations of more than 300,000) for public transit.
“Urban dwellers today want convenience,” said Redfin chief economist Nela Richardson. “Particularly in congested urban areas, a car may be the slowest way to get around the city. Homes near bus and subway lines tend to have higher values that hold up even during housing downturns. The fact that many cities are also investing in alternative forms of transit, like bike share, indicates how highly prized access to transit is by their residents.”
Among the 130 newly added cities are big ones like Phoenix (32.2) and Detroit (37.9), as well as smaller cities with big Transit Scores like Union City, N.J. (80.2) and State College, PA (63.7).
“After schools, access to public transportation is what New Jersey homebuyers ask about most frequently,” said Nick Boniakowski, Redfin market manager. “We spend a lot of time with our clients researching nearby bus and rail routes and stops, so being able to easily see that Union City, for example, has a higher Transit Score than pricier Jersey City (70) gives buyers another easy way to compare and evaluate homes, neighborhoods and cities.”
None of the cities on the list score in the 90 to 100 range, which Walk Score defines as a “riders’ paradise.” However, individual neighborhoods in many cities are riders’ paradises, like Boston’s Bay Village (100), Philadelphia’s Logan Square (100), The Loop (99.1) in Chicago and Belltown (98.1) in Seattle. Some cities that didn’t make the top 10 list are home to riders’ paradises, including downtown Pittsburgh (97.1), Old Town Chinatown (92.2) in Portland, Ore. (50.8) and downtown Houston (92.8).
Survey Methodology
The Transit Score algorithm calculates a score by summing the relative "usefulness" of public transit (bus, subway, light rail, ferry, etc.) routes near a given location. Usefulness is defined as the distance to the nearest stop on the route, the frequency of the route, and type of route (with twice as much weight given to heavy/light rail than to bus service). Transit Score is based on data published in General Transit Feed Specification (GTFS) format by transit agencies across the country.
More Management
FIFA World Cup Matches Are Driving Record Transit Ridership Nationwide
See how World Cup matches are generating record transit demand across North America, with ridership surpassing Super Bowls, concerts, and Olympic-era events.
Read More →
The Hidden Cost of Fuel Data Inaccuracy in Public Transit Fleets
In today's transit environment, accurate fuel and mileage data are critical to reducing costs, minimizing downtime, and improving fleet performance.
Read More →
Virginia's $28.5B Transportation Plan Targets Transit and Rail
Approved by the Commonwealth Transportation Board, the program supports ongoing infrastructure projects while providing new investments in transit, state of good repair and transportation alternatives.
Read More →
Latinos In Transit Seeks Host Organization for 2027 Leadership Summit
The selected host organization will showcase its transit system, projects, and community while welcoming hundreds of industry leaders and emerging professionals during Hispanic Heritage Month.
Read More →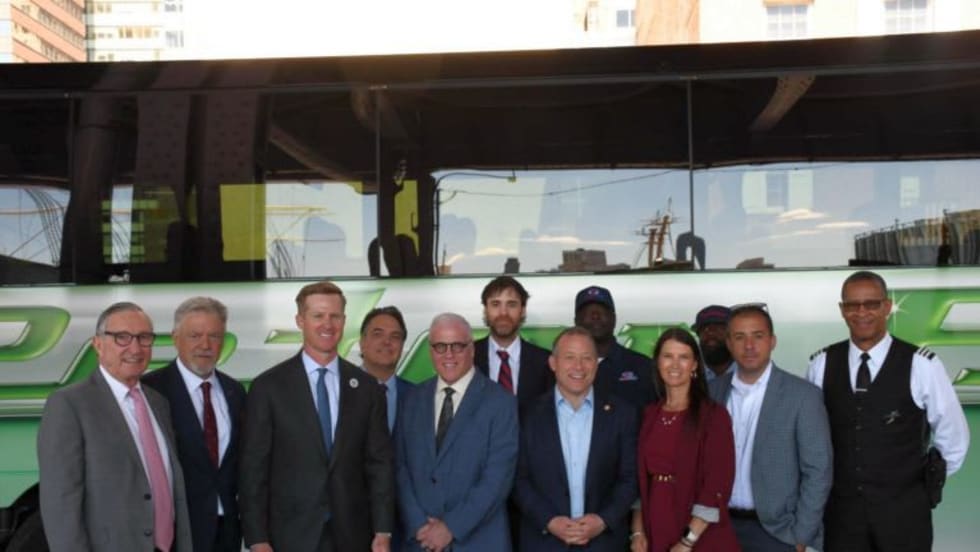
Bipartisan BUSES Act Seeks Changes to New York City's Bus Idling Enforcement Program
Backed by motorcoach operators, the legislation seeks to balance emissions goals with passenger safety by allowing limited idling for inspections, accessibility needs and extreme weather conditions.
Read More →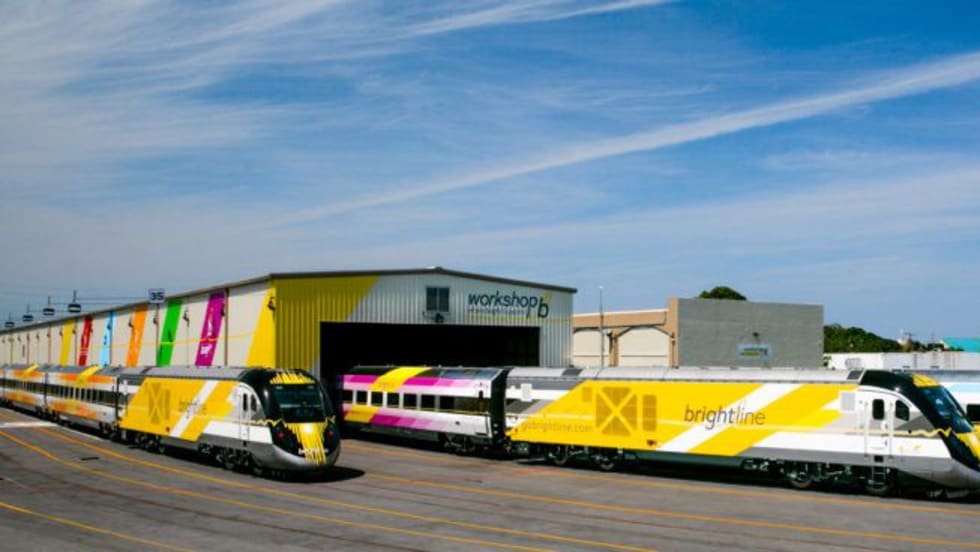
DOT: Brightline Corridor Incidents Fall 30% Following Federal Safety Upgrades
Safety improvements funded through a $25 million federal investment are credited with reducing trespassing and train-vehicle collisions along the Brightline Florida corridor.
Read More →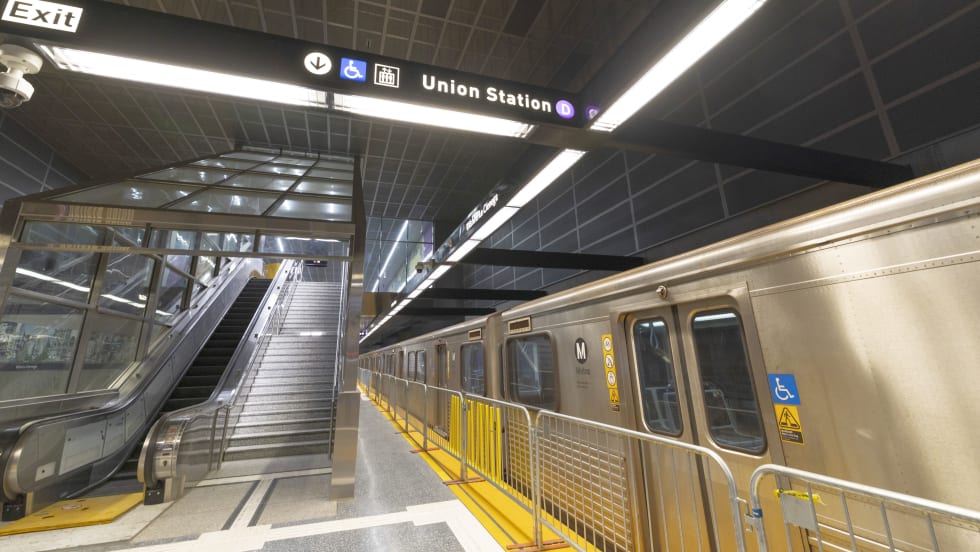
D Line Expansion Fuels Growth Across LA Metro's Rail System
Weekend rail ridership was especially strong, soaring 18% as riders embraced expanded access to jobs, entertainment, dining, and cultural destinations, said the agency. Total system ridership for May, including bus and rail, was 26,966,657.
Read More →
Q4 Travel Data Reveals Drop in Vehicle Traffic to Manhattan Congestion Zone
NYMTC’s quarterly Travel Patterns Report provides a snapshot of travel activity throughout New York City, Long Island, the Lower Hudson Valley, and northern New Jersey using data collected from the agencies operating the region’s bridges, tunnels, and public transit systems.
Read More →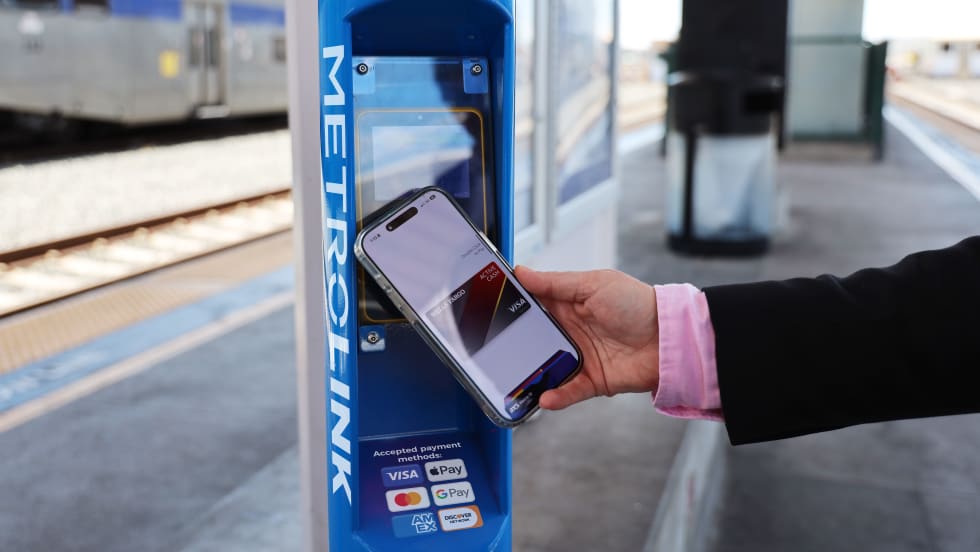
Southern California's Metrolink Debuts Contactless Fare Payment Pilot
Customers traveling between Redlands and Los Angeles can now tap their preferred payment method, including a credit or debit card, mobile wallet, or wearable device, at station validators before boarding and again while exiting.
Read More →
California's BART Approves FY27 Budget While Maintaining Service Levels
The budget covers July 1, 2026, through June 30, 2027, a period when pandemic emergency funds run out, the District faces a structural deficit of $375 million, and a regional transit funding measure may appear on the November ballot.
Read More →