
RELATED: LA Metro to tackle traffic reduction, evaluate new mobility
Best (and Worst) Cities for Commuting on Public Transportation in the U.S.
The No. 1 ranked public transportation network allows riders to get nearly anywhere in the area within 30 minutes.
by Francesca Ortegren
February 22, 2020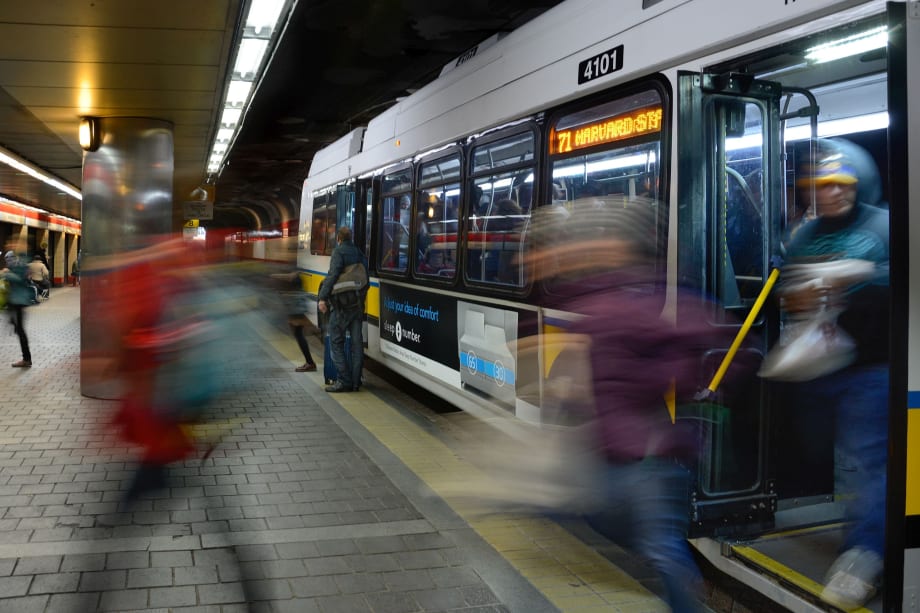
MBTA
11 min to read

Boston's public transportation network, which allows riders to get nearly anywhere in the area within 30 minutes, ranked No. 1. MBTA
(The original version of this article was posted by Clever Real Estate.)
The 650 transit lines across the world served hundreds of cities and 53 billion passengers in 2017. Mass transit is extremely popular, leading to rapid growth since the 1980s: Approximately 75 new metro systems opened since the turn of the century, which increased the availability of metros by 50% and ridership has jumped 21% just since 2013.
That might not always be the case for U.S. public transportation, though, as we lag behind much of the rest of the world in innovation and ridership. In fact, while the majority of worldwide transit systems saw increases in ridership since 2012, all U.S. systems except those in NYC lost passengers during that time. Perhaps this is because the U.S. rail system and buses are in subpar condition.
The Cost of Public Transit
While mass transit benefits the community at large by reducing traffic congestion, bolstering the local and national economies, and increasing access to healthcare, it isn’t always worth the investment. According to City Lab, building transit systems in the U.S. is particularly expensive, with costs up to $2.6 billion per mile of underground rail system.
That expense pays off in places like New York, where ridership is consistent with expectations. The Second Avenue Subway in New York costs about $25,000 per daily rider, a value that’s on par with other systems across the world.
But the balance between the high cost of development and ridership isn’t always so easy. The Loop Trolley in the St. Louis area, for example, cost over $50 million to construct. But it only attracted 17,292 riders for the entire year, equating to a cost of over $600,000 per daily rider. Even more comprehensive line additions, like Boston’s Green Line Extension, can approach $45,000 to $100,000 per daily rider. In some cases, that’s a lot of taxpayer money going toward systems that might not pay off.
We know that massive urban areas like New York City have widespread and consistent ridership while others fall behind the curve; so we considered the discrepancy between commuting to and from work via public transportation or driving alone in order to evaluate which U.S. metropolitan areas have the worst public transportation systems in the U.S., and where you can find the best transit systems.
To do that, Clever Real Estate focused on 30 U.S. metro areas that have a need for public transportation. It ranked them based on four metrics that indicate superior public transportation: ridership, costs, time to commute, and earnings.
Check out the states with the best public transportation and where you can find them.
The Worst Cities for Public Transportation
Dallas / Fort Worth, Texas
The DFW metroplex covers over 9,000 square miles in north Texas, but public transportation leaves something to be desired. Together, Dallas and Fort Worth have only 161 bus lines, three rail, and four light rail line systems.
And, while nearly $11 billion has been invested in transit systems in Dallas alone since 1999 — with plans continue to add services that connect Dallas and Ft. Worth — they still fall behind the curve.
People generally avoid public transportation as a way to get to and from work in the metro, with nearly 81% of workers choosing to drive alone. Those who do use public transportation as a means to commute spend over 200 additional hours commuting to and from work each year and earn less than drivers.
The latter (along with low ridership in general) provides support that the DFW transit system isn’t up to par lies in the income discrepancy between car and transit commuters: Public transportation commuters earn over $15,000 less than drivers on average, suggesting that transportation is less available in wealthier areas or people choose to avoid it if they can afford a vehicle.
Luckily for commuters, the lack of public transit is counterbalanced with better-than-average driving conditions: Ft. Worth was named the 2nd best city for drivers due to low traffic fatalities and high-quality roads and according to an analysis by TomTom, the metro’s traffic congestion is typically far below average.

Riverside, Calif.
Riverside’s public transportation was among the worst in the U.S. The area has only 26 bus and 3 rail lines that are less than comprehensive and extremely time consuming for commuters: The average commute time for those who take public transportation is over an hour each way (the longest on our list) compared to about 30 minutes driving.
Riders don’t disagree that the transport isn’t great in Riverside, either. One agency, the Riverside Transit Agency, has only 2 stars on Yelp, many citing the lack of reliability in the schedule for their low ratings.
San Antonio, Texas
The San Antonio metro area has a public transit system made up of 94 bus lines that cover only about 75% of the area. Their main system, VIA, falls behind other metro services in their coverage, reliability, and quality.
VIA, for instance, received 3.36 complaints per 10,000 riders in 2019 — more than they had in 2017 or 2018 — according to the agency’s reports. The buses aren’t reliable, either. They have common breakdowns and are on time less than 80% of the time.
Unfortunately for San Antonio commuters, the metro is one of the fastest growing in the nation and, as a result, the miles traveled by drivers in the area has jumped 15% in the last decade. So commuters are stuck choosing between two subpar options.
San Diego, Calif.
Much like San Antonio, commuters in San Diego have only a few good options for getting to and from work. The southern California metro has only 81 bus, 3 light rail, and 1 ferry lines, making public transit commutes difficult.
Those who ride the system are among the lower income in the metro area, as well. In fact, the median household income of those who commute via public transportation earn half as much as those who drive to work.

Even still, San Diego ranks in the worst areas for traffic congestion both in the U.S. (40th) and worldwide (184 out of over 1,300 cities). Investing in public transportation could be a great way to address the city’s traffic woes.
Las Vegas, Nev.
Vegas is home to casinos, extravagant hotels, and the University of Nevada Las Vegas. It’s certainly not known for great public transportation; the metro has little transit coverage with only about 31 bus lines.
Vegas transit commuters are at a huge disadvantage compared to drivers in that they spend nearly $5,000 more on their commute each year (actual and opportunity costs), spend an additional 300 hours commuting, and they earn over $16,800 less than drivers.
The Las Vegas-Henderson metro isn’t bad for drivers, though. Not many commuters are classified as “super commuters,” who have a one-way commute more than 90 minutes, and at about 25 minutes, the average driving commute time is lower-than-average.
Best Public Transportation in the U.S.
So, where can you find the best U.S. transit systems?
Boston, Mass.
The Boston metro transit landed the #1 spot in our ranking. The metro is home to 113 bus, 12 rail, three subway, five light rail, and two ferry lines that allow riders to get nearly anywhere in the area within 30 minutes.
According to a recent analysis by Clever Real Estate, Boston was named one of the worst places to commute by car, partly because the city has the worst rush-hour traffic congestion in the nation. So it’s no surprise that over 13% of commuters choose public transportation.
And, while commuting via public transportation always requires more time than driving on average, the comprehensive Massachusetts Bay Transportation Authority allows commuters to get to and from work for only $1,256 per year compared to the $3,450 drivers pay in gas and maintenance alone.
Seattle, Wash.
Seattle is home to large national companies, like Amazon, Microsoft, and Starbucks, that employ thousands of residents — many of whom prefer public transit over driving.
According to Walk Score, Seattle is super walkable and has a good public transportation system with 220 bus, 4 light rail, and 3 ferry lines servicing the area. The availability of public transportation saves commuters $3,300 annually ($4,700 to drive versus $1,400 to take public transportation).
What’s more, the median income of commuters who drive is similar to that of those who take public transportation, suggesting the transit is in good condition and “user friendly.”
Washington, D.C.
Not surprisingly, Washington, D.C. was by far the worst city for driving commuters in our previous study. Drivers spend nearly the same commuting by public transportation ($1,900) and by car ($1,600) each year, but the metro landed toward the top of our list because of its top-notch transit system.
The metro area is served by 135 bus, 2 rail, and 6 subway lines that sprawl across the area. And, with over 626,000 riders each weekday, the system is the second-busiest in the U.S. behind New York City.
People who commute by public transportation in D.C. earn more than drivers, which is only also true for three other cities on our list; typically, transit commuters earn significantly less than do drivers.

Austin, Texas
The Texas capital draws people from all over and, as a result, has become one of the fastest growing cities in the U.S. Unfortunately, their rapid growth and position around Interstate 35 — a major thoroughfare for shipping between Canada and Mexico — make driving difficult.
The city has the 14th worst traffic congestion in the U.S. and the worst in the state, forcing many to find alternative options to commute to and from work. As luck would have it, the cost to commute via public transportation is pretty affordable at less than $500 a year.
Pittsburgh, Pa.
Pittsburgh is home to 446 bridges and miles of tunnels through which 260,000 vehicles travel each day. The rolling landscape and bridge-laden routes into the city center have helped bump Pittsburgh to the 7th worst city for traffic congestion in the U.S.
That traffic is compounded by high costs of commuting by car (~$6,500 annually), incentivizing the use of the metro’s 2 funicular, 92 bus, and 3 subway lines instead of driving.
And, while public transit still takes longer than driving (as it does in all the metros we evaluated), the difference is much smaller in Pittsburgh than other places: People who commute via public transportation spend about 25 minutes longer commuting to work than drivers.
Public Transportation Commutes are Lengthy
On average, commuting by way of public transportation takes 1.8x as long as driving to and from work. This leaves the average commuter on a bus or train for over 400 hours — or nearly 17 days — getting to and from work each year.
According to an analysis on commuting by car, long commutes are stressful and impact health and job satisfaction. So nearly doubling the amount of time people commute could be detrimental.
The time associated with commutes is related to our opportunity cost measure in that more time committed to commuting is an opportunity to earn extra cash (or binge Netflix, play with your kids, or go to a museum) lost. To quantify that cost, we considered people’s hourly earnings.
Even though those who commute via public transportation earn less on average than those who drive, the opportunity cost of public transportation was almost always higher or similar to driving because of the vast time differences between the two modes of transportation.

But commuting by public transportation is a different experience altogether. More specifically, a defining factor in stress related to car commuting has to do with the unpredictability of traffic conditions, which is likely more salient to a driver than a rider.
Passive commuting also leaves time for other activities, whether it be leisurely scrolling through social media, working, or reading a book that aren’t options for drivers.
In short, the true “cost” of the time commitment related to public transportation commutes seems to be on a completely different scale than driving. The longer commutes, then, might not be as costly in terms of health, productivity, and happiness.
Research from McGill University provides evidence that people who ride a train to work are happier than people who drive to work. Interestingly, though, they found that bus riders weren’t significantly different from drivers, suggesting that volatility in driving conditions influences happiness.
Cost Varies by Location
The actual cost of commuting by public transportation was calculated as the price of a 30-day unlimited pass (multiplied by 12) and the per-person taxes funding transportation in the metro. On average, Americans spend less than $1,000 commuting (~$940) each year — significantly less than the $6,500 drivers spend.
The cheaper mode of commute depends on your location: It’s actually cheaper to commute via driving in places like Washington, D.C., and New York City than public transportation, but drivers spend nearly $6,000 more in Vegas than public transport commuters.
The discrepancies between driving and public transportation are due to a number of factors, like gas prices in the metro, distance of commute, and taxes paid toward public transportation. Both Washington, D.C. (~$980) and NYC ($310) residents put more money toward public transportation each year than other metros on our list.

Pumping more tax dollars into public transportation might put a little bit of strain on your wallet, but that funding is doing its job. A regression analysis revealed that a larger proportion of the population uses public transportation in metros where more tax money is allocated to the local transit agencies, even if you control for total population size. In other words, people are getting their money’s worth in places where more taxes go toward funding public transportation.
Check out the complete survey findings and the methodology today.
About the Author: Francesca Orteren is a Research Associate at Clever Real Estate.
More Management
Act Now to Join Rays the Mark Foundation's Annual Golf Tournament, Fundraiser
This year's tournament honors Emily DeVito, a member of the public transportation family whose story has moved colleagues across the industry — and with only a few foursomes remaining, organizers are encouraging companies and individuals to register soon.
Read More →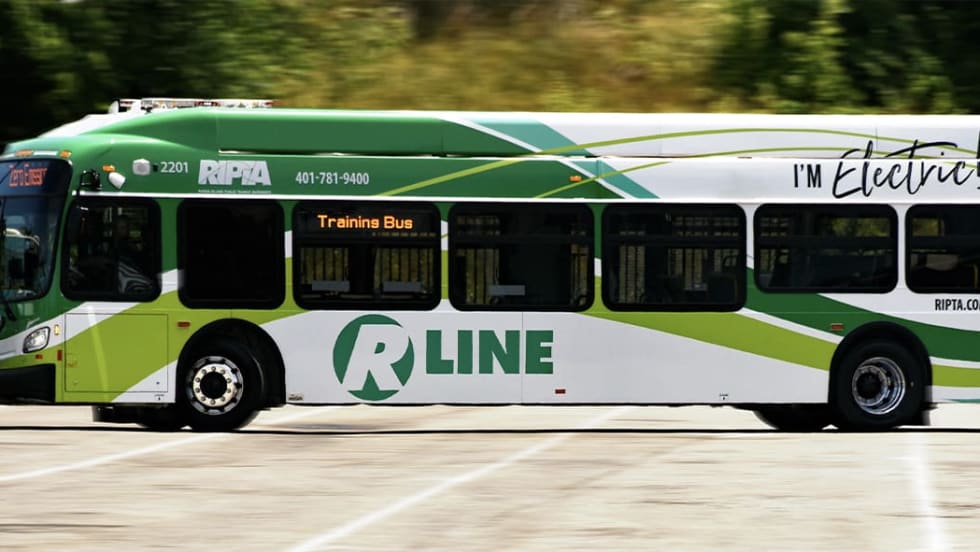
RIPTA Celebrates 60 Years of Public Transit Service
The Rhode Island agency is marking the milestone by highlighting service improvements, mobility initiatives, and its vision for the future of transit.
Read More →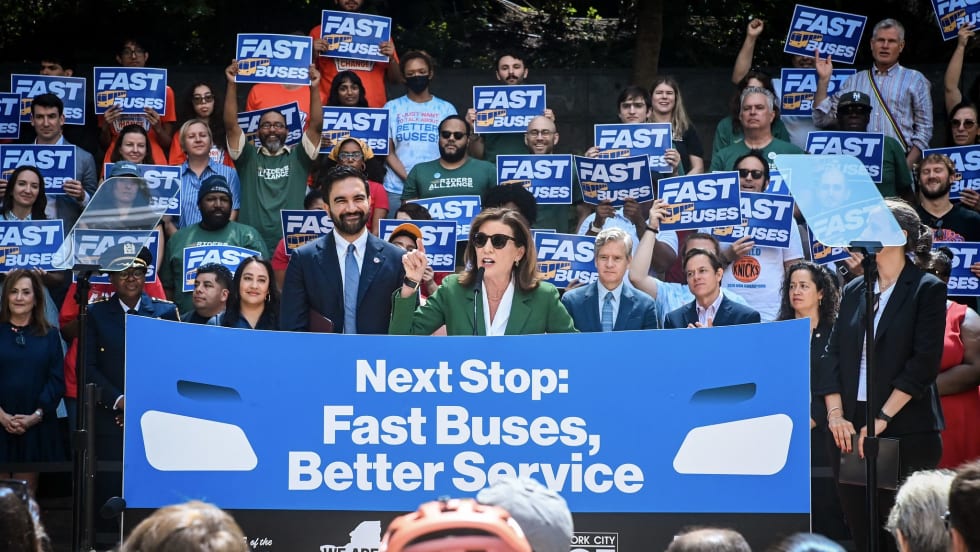
New York Unveils Sweeping Plan to Modernize City Bus Service
Next Stop: Fast Buses, Better Service identifies 50 priority bus corridors for improvements across the five boroughs and launches the City’s next generation of rapid bus service along five key routes.
Read More →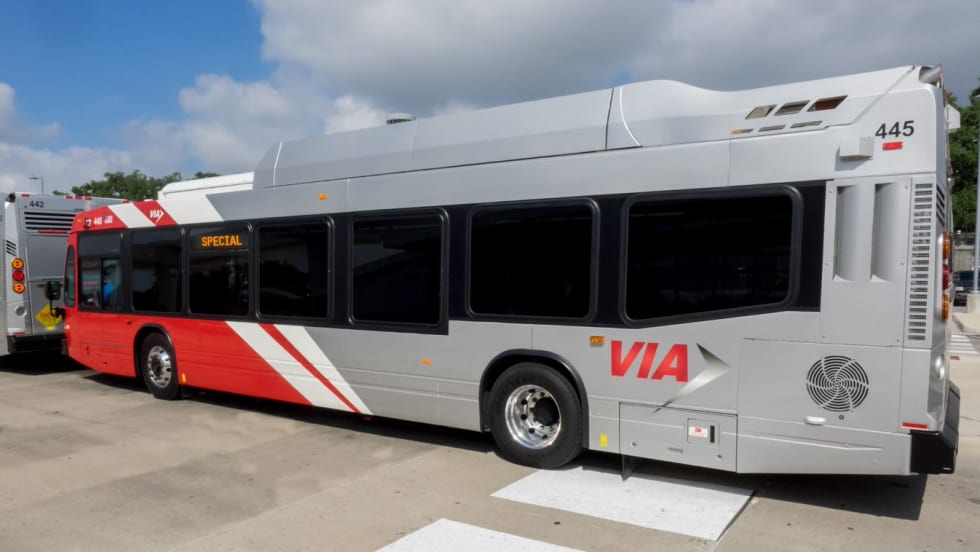
San Antonio's VIA Launches Second Year of Data Fellowship Program
The partnership gives Better Futures Scholars hands-on experience with real-world challenges while providing VIA with additional analytical capacity to support key agency priorities.
Read More →
CTDOT Taps STV for Electric Bus Facility Design
The firm will work with CTDOT and RVT to define the facility layout, operational requirements, and long-term flexibility for RVT’s growing electric fleet.
Read More →
USDOT Awards $170M for Transit Projects in Latest BUILD Grants
Federal funding will support maintenance facility upgrades and other projects aimed at improving transit safety and reliability across the U.S.
Read More →
Keolis and SNCF Voyageurs Bring Rail Expertise to California High-Speed Rail
The CDA establishes a collaborative predevelopment partnership intended to evaluate future delivery opportunities through public-private partnership models.
Read More →
Ford to Leave JTA After More Than 10 Years as CEO
He plans to continue his work advancing innovative mobility solutions to improve the quality of life in communities across the nation. He did not announce specific plans.
Read More →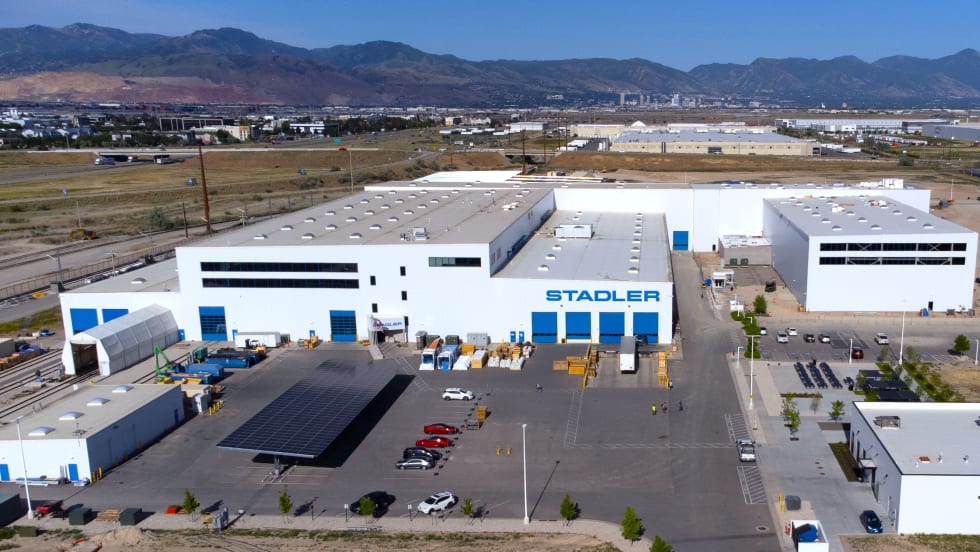
Stadler Marks 10 Years in the U.S. with Salt Lake City Expansion
The expansion is expected to create up to 300 new local jobs, some of which are youth apprenticeships, said Stadler officials.
Read More →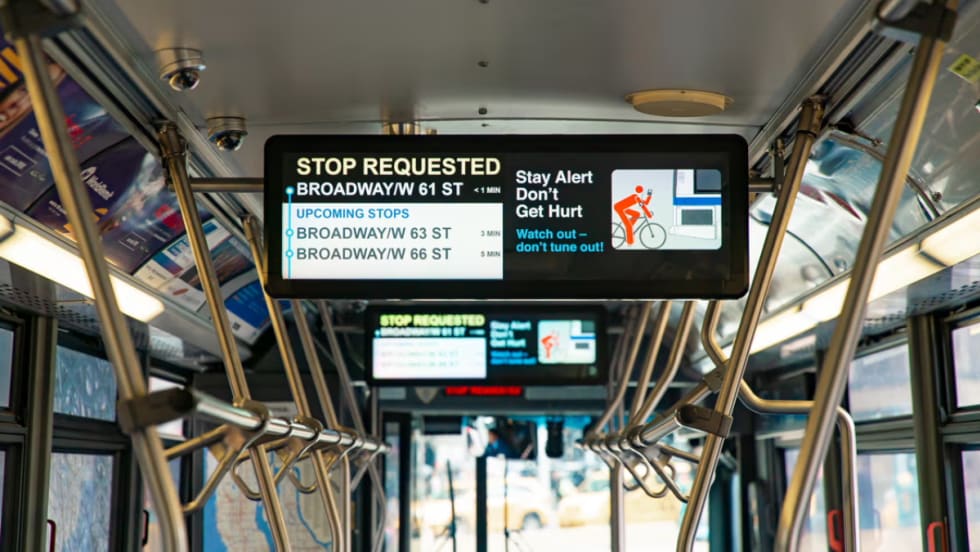
Hitachi Rail Completes Acquisition of Intelligent Transportation Systems Provider Clever Devices
The acquisition expands Hitachi Rail's North American presence and multimodal capabilities, combining rail and bus technologies to deliver more integrated digital solutions for transit agencies.
Read More →