
Report: Honolulu Named Top Commuter Transit City
The Brookings Institution’s report reviewed commuter transit in 100 cities across the U.S. and found that nearly 70% of working people live in neighborhoods that offer transit service.


Honolulu provides the best access to public transportation for commuters in the U.S., according to a study recently released by The Brookings Institution.
Photo: Oahu Transit.
Honolulu provides the best access to public transportation for commuters in the U.S., according to a study recently released by The Brookings Institution, “Missed Opportunity: Transit and Jobs in Metropolitan America,” Reuters reported.
The Los Angeles metropolitan area took the second spot, with San Jose, Calif.; El Paso, Texas; and San Francisco rounding out the top five. The report also found that in the U.S.'s 100 largest metropolitan areas, nearly 70 percent of working-age people live in neighborhoods that offer transit service. For the full story, click here.
To view the report, click here.
Top and Bottom Metropolitan Areas for Share of Working-Age Residents with Access to Transit
Rank/ Metropolitan Area/ Coverage (%)
Top 10:
1. Honolulu — 97.0
2. Los Angeles-Long Beach-Santa Ana, Calif. — 96.0
3. San Jose-Sunnyvale-Santa Clara, Calif. — 95.6
4. El Paso, Texas — 94.3
5. San Francisco-Oakland-Fremont, Calif. — 91.7
6. Modesto, Calif. — 90.4
7. New York-Northern New Jersey-Long Island, N.Y.-N.J.-PA — 89.6
8. Salt Lake City — 89.0
9. Miami-Fort Lauderdale-Pompano Beach, Fla. — 88.8
10. Las Vegas-Paradise, Nev. — 85.5
Bottom 10:
91. Baton Rouge, La. — 34.2
92. Portland-South Portland-Biddeford, Maine — 33.1
93. Nashville-Davidson--Murfreesboro--Franklin, Tenn. — 32.2
94. Birmingham-Hoover, Ala. — 32.1
95. Richmond, Va. — 30.8
96. Augusta-Richmond County, Ga.-S.C. — 30.2
97. Jackson, Miss. — 30.0
98. Knoxville, Tenn. — 27.9
99. Greenville-Mauldin-Easley, S.C. — 27.7
100. Chattanooga, Tenn.-Ga. — 22.5
(Source: Brookings Institution analysis of transit agency and Nielsen Pop-Facts 2010 data)
Top and Bottom Metropolitan Areas for Average Share of Jobs Accessible in 90 Minutes via Transit
Rank/ Metropolitan Area/Share of Jobs Reachable in 90 Minutes (%)
Top 10:
Honolulu — 59.8
Salt Lake City — 58.9
San Jose-Sunnyvale-Santa Clara, Calif. — 58.4
Madison, Wis. — 58.2
Tucson, Ariz. — 57.2
Fresno, Calif. — 57.0
Albuquerque, N.M. — 52.9
Milwaukee-Waukesha-West Allis, Wis. — 48.6
Provo-Orem, Utah — 48.3
Denver-Aurora, Colo. — 47.5
Bottom 10:
91. McAllen-Edinburg-Mission, Texas — 16.6
92. Augusta-Richmond County, Ga.-S.C. — 16.4
93. Tampa-St. Petersburg-Clearwater, Fla. — 16.3
94. Miami-Fort Lauderdale-Pompano Beach, Fla. — 16.2
95. Orlando-Kissimmee, Fla. — 15.8
96. Virginia Beach-Norfolk-Newport News, Va.-N.C. — 15.4
97. Youngstown-Warren-Boardman, Ohio-Pa. — 14.2
98. Poughkeepsie-Newburgh-Middletown, N.Y. — 8.2
99. Riverside-San Bernardino-Ontario, Calif. — 7.9
100. Palm Bay-Melbourne-Titusville, Fla. — 7.4
(Source: Brookings Institution analysis of transit agency, Nielsen Pop-Facts 2010, and Nielsen Business-Facts data)
More Bus
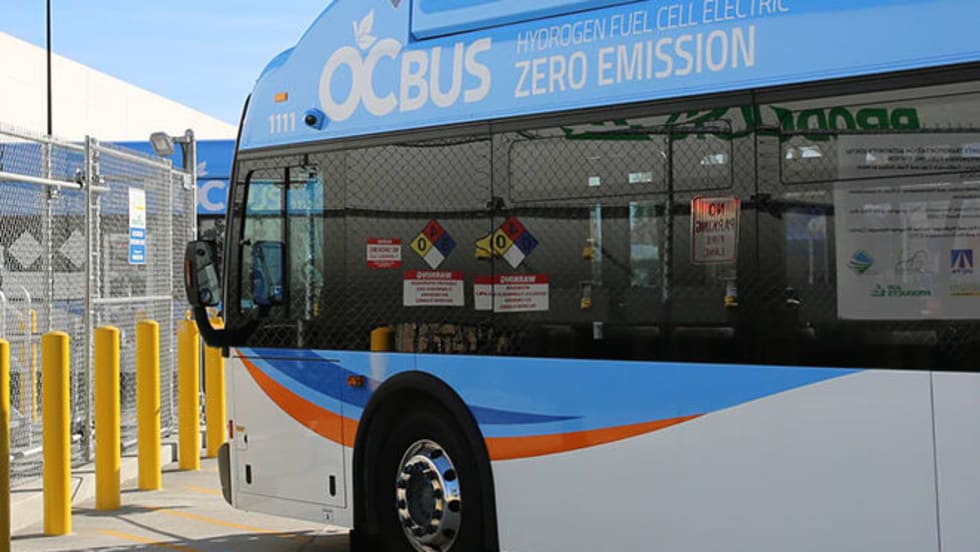
Biz Briefs: OCTA Taps Clean Energy for Hydrogen Station, Stadler to Supply Via Rail Vehicles, and More
From manufacturers and suppliers to transit agencies and motorcoach operators, these updates offer a snapshot of the projects, partnerships and business moves driving the industry forward.
Read More →
METRO Magazine Announces 2026 Innovative Solutions Awards Winners
Projects Recognized for Advancing Mobility Through Technology, Accessibility, Workforce Innovation, and Operational Excellence
Read More →Biz Briefs: STV teams with Amtrak, Motorcoach Operators Boost Fleet and Land Contracts, and More
From manufacturers and suppliers to transit agencies and motorcoach operators, these updates offer a snapshot of the projects, partnerships and business moves driving the industry forward.
Read More →
LA Metro Marks Banner Year, Sets Ambitious Goals for New Fiscal Year
Incoming LA Metro Board Chair and Los Angeles Mayor Karen Bass joined outgoing Board Chair Fernando Dutra and LA Metro CEO Stephanie Wiggins to review accomplishments from fiscal year 2026, which included the opening of new rail extensions, advancement of major transit projects, expanded safety programs, and new rider amenities.
Read More →
DART Taps Nathaniel P. Ford Sr. as Next President/CEO
Since 2012, Ford has served as the CEO of the Jacksonville Transportation Authority
Read More →
AC Transit’s Cecil Blandon on Building the Next Generation of Transit Maintenance Leaders
The agency’s maintenance chief discusses leadership, workforce development, zero-emission technology, and preparing technicians for the future of public transportation.
Read More →
Building the Next Generation of Transit Technology
In this edition of METROspectives, Luminator CEO Magnus Friberg discusses the company's transformation, the growing role of AI and software, and what's next for transit technology.
Read More →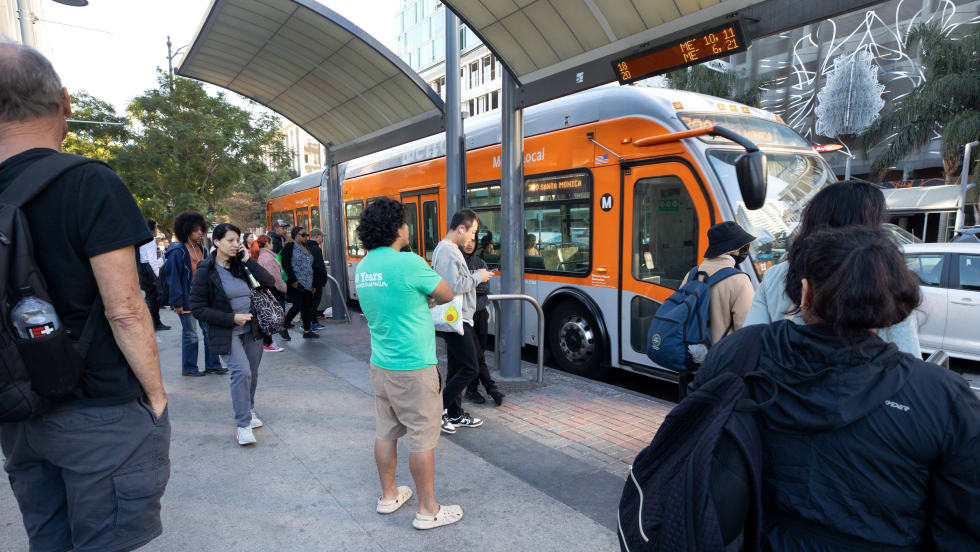
June LA Metro Ridership Surges 2 Million Year Over Year
Total June ridership increased for both weekdays and weekends. Weekday ridership was 953,820, which grew 8.4% from June 2025; Saturdays increased nearly 13% year-over-year to 708,826; and Sundays increased 7.7% to 611,534 from June 2025, according to LA Metro.
Read More →
Washington's Pierce Transit Board Sends Transit Funding Measure to November Ballot
With the adoption of Resolution 2026-006, the measure moves to the Pierce County Auditor, giving voters in the Pierce Transit service area the decision on whether to fund an expansion of local transit service within the agency’s service area.
Read More →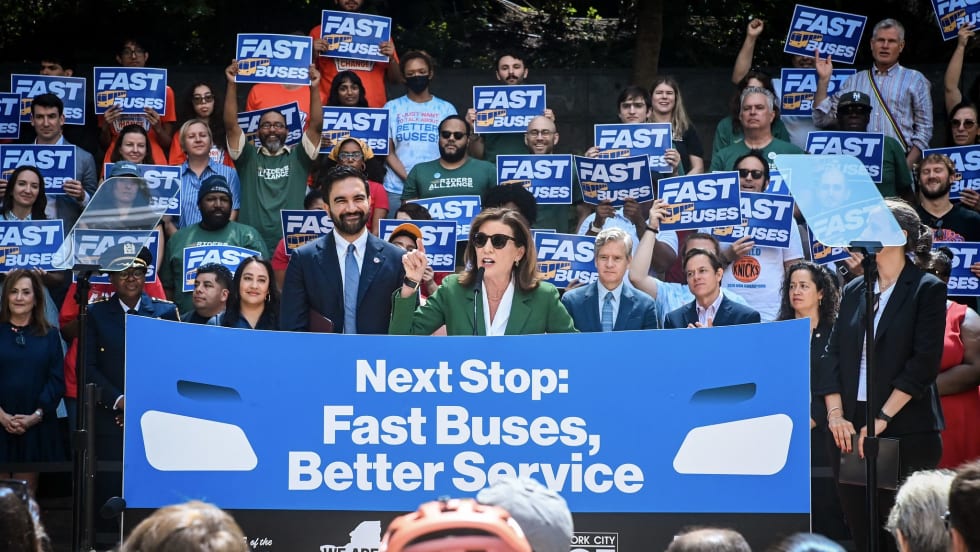
New York Unveils Sweeping Plan to Modernize City Bus Service
Next Stop: Fast Buses, Better Service identifies 50 priority bus corridors for improvements across the five boroughs and launches the City’s next generation of rapid bus service along five key routes.
Read More →