

Read More: Denver RTD Announces Launch of Zero Fare for Youth
Denver RTD Releases Results of 2023 Study
The results of the 2023 survey, which was conducted in September, were shared this morning during a public RTD meeting.
October 17, 2023
The survey findings indicate that 76% of bus customers and 78% of rail customers are “satisfied” or “very satisfied” with RTD services.
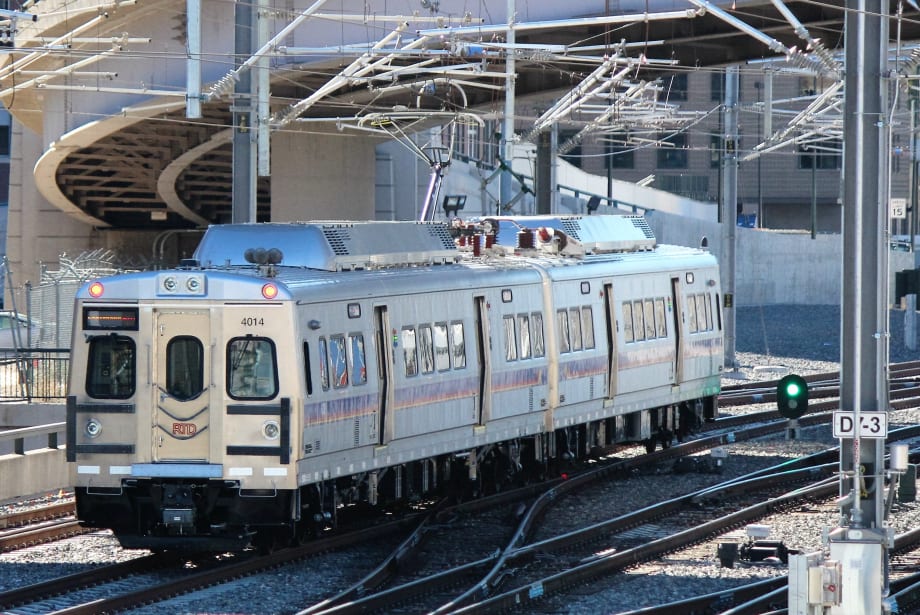
Photo: RTD
2 min to read
The Regional Transportation District (RTD) announced it has conducted a survey of customers, community members, and stakeholders to better understand its strengths and identify opportunities for improvement.
The results of the 2023 survey, which was conducted in September, were shared this morning during a public RTD meeting.
The customer-focused portion of the survey included a sampling of individuals using all bus routes and rail lines, and it was conducted using customer intercepts.
Custmer Survey Results
The survey findings indicate that 76% of bus customers and 78% of rail customers are “satisfied” or “very satisfied” with RTD services.
Additionally, the percentage of customers who were “very dissatisfied” decreased in comparison with 2022.
RTD also saw double-digit increases in the percentage of customers who felt adequately informed about disruptions and the cleanliness of trains and buses.
Other improvements from 2022 include the percentage of customers who indicated that RTD’s communication materials are high quality and that fare prices are reasonable.
The survey also provided RTD with a Net Promoter Score (NPS), which is an indication for how likely someone is to recommend the agency’s services to a friend or neighbor.
RTD’s NPS score for rail increased by five points and decreased by three points for bus. Both scores remain above zero, meaning that RTD has more promoters in the community than detractors.
“It is important for RTD to understand customers’ perceptions, attitudes and opinions regarding the agency’s services and how the agency can strive to improve,” said Debra A. Johnson, RTD’s GM/CEO. “You cannot manage what you do not measure, so it was important for RTD to seek meaningful feedback from its customers, stakeholders and community members. This valuable information provides RTD with insight into customers’ and the community’s pain points.”
More Results from RTD Survey
In addition to collecting customer feedback, separate surveys solicited input from households and key stakeholders in RTD’s service area.
The community survey was mailed to a random sample of USPS addresses throughout the eight-county district, and results were monitored to maintain demographic distribution that was in proportion to the region.
Highlights from the community survey include 84% of respondents indicating that RTD provides value to the region, and 87% of respondents noting that the agency’s funding should be somewhat or much greater.
Respondents to the key stakeholders’ survey included chambers of commerce, transportation management organizations/associations, major employers, and institutions of higher education.
Nearly 80% of stakeholder respondents believe the agency is somewhat or very effective at providing service to employment centers, and 90% of respondents agree that RTD provides value to the Denver metro region.
RTD’s survey was conducted by ETC Institute.
More Management
Sponsored•August 2, 2026
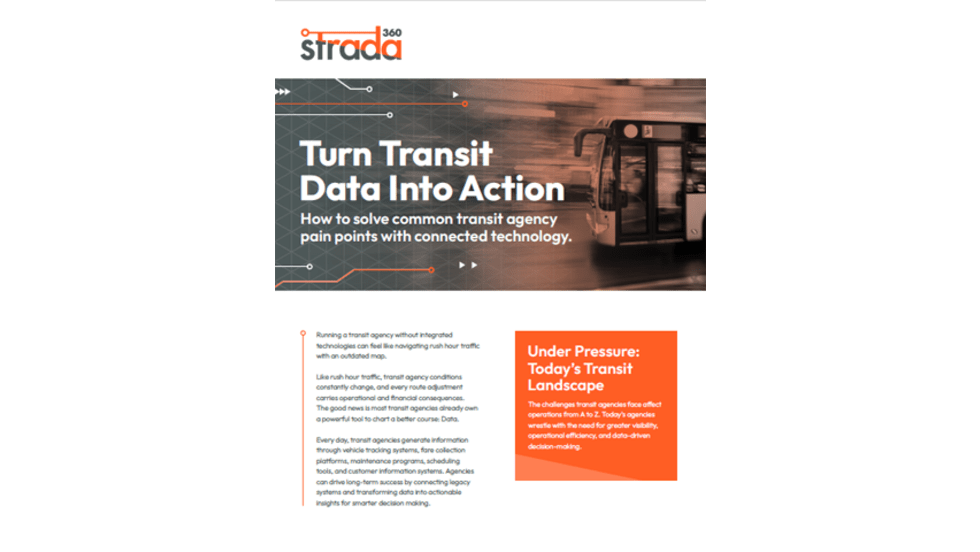
Turn Transit Data Into Action
Discover how leading agencies are using connected technology to gain real-time visibility across operations, improve service reliability, and reduce disruptions.
Read More →
What Transit-Oriented Development Means for the Future of Public Transportation
Once viewed primarily as transit operators, agencies are now leveraging land, partnerships, and long-term planning to boost ridership, expand housing, and strengthen communities.
Read More →
USDOT Announces $22 Million for Transit Innovation, Updates High-Speed Rail Rules
New federal transit funding will support safety, accessibility, and technology projects as updated rail regulations establish new noise standards for high-speed trains.
Read More →
Transportation Construction Coalition Unveils Infrastructure Case Studies Ahead of Federal Funding Deadline
The coalition noted the next surface transportation bill should provide sustained investment in highways and public transit to strengthen freight movement, improve safety, and support economic growth.
Read More →
People Movement: American Bus Association Extends Ferguson and More
METRO’s People Movement highlights the latest leadership changes, promotions, and personnel news across the public transit, motorcoach, and people mobility sectors.
Read More →
METRO Magazine Announces 2026 Innovative Solutions Awards Winners
Projects Recognized for Advancing Mobility Through Technology, Accessibility, Workforce Innovation, and Operational Excellence
Read More →
MBTA Rolls Out Pilot Programs to Cut Costs, Simplify Travel
Three new fare pilots — including unlimited two-hour transfers, reduced express bus fares, and free transit for eligible seniors — will launch this fall as Massachusetts extends popular commuter rail discounts through November.
Read More →
FTA Opens $610 Million Funding Opportunity for Bus Infrastructure Projects
The latest Notice of Funding Opportunity provides transit agencies with funding for bus facilities, fleet modernization, and low- and no-emission vehicles, with applications due September 21.
Read More →Biz Briefs: STV teams with Amtrak, Motorcoach Operators Boost Fleet and Land Contracts, and More
From manufacturers and suppliers to transit agencies and motorcoach operators, these updates offer a snapshot of the projects, partnerships and business moves driving the industry forward.
Read More →
Massachusetts Approves $530M to Strengthen MBTA Operations, Infrastructure
The funding package targets operating stability, capital improvements, and fare affordability, offering a model for agencies navigating long-term funding challenges.
Read More →