
Upon initial introduction to the (YRT) garages in December 2017, we have seen an average 50% reduction in unsafe and uneconomical vehicle use.
Case Study: Empowering safe and efficient vehicle use with data
INIT has worked closely with York Region Transit to develop, test and roll out the MOBILE-ECO2 driver support system.
by By Ann Derby
July 2, 2018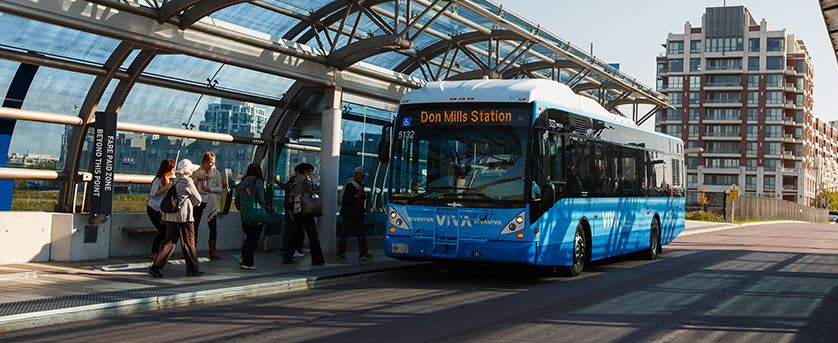
INIT has worked closely with York Region Transit (YRT) to develop, test and roll out MOBILE-ECO2 on all new vehicles, while also working to integrate into later models. Photo: YRT/VIVA
6 min to read
Safety costs
In the past decade, over 255,000 buses were involved in a crash resulting in over 107,000 injuries and 1,180 fatalities in the U.S. alone, as reported by the US Department of Transportation (USDOT) Federal Motor Carrier Safety Administration (FMCSA) [1]. Although the exact value of the lives impacted is priceless, the agency has estimated that such crashes resulted in excess of $60 billion USD [1] in terms of medical, legal, property damage and economic costs, for example. Further, the USDOT National Highway Traffic Safety Administration (NHTSA) has reported that over 90% of vehicle-based crashes can be tied back to human choice or error [2], which means many of these crashes could have been prevented in the first place.
Considering these statistics, there is much we can do to save the precious lives lost on our roadways every day. With over 90% of such crashes being attributed to human error, this begs the question, what are we doing wrong? Research indicates that such crashes are perpetuated by drivers who engage in aggressive as well as distracted driving [2]. Fortunately, such behavioral issues can be corrected, therefore preserving many of the lives lost in crashes. With even marginal changes in driving behavior, millions of dollars, thousands of buses, and countless lives can be saved.
Lifecycle costs
In addition to the safety considerations that put roadway users at risk, the cost associated with how vehicles are used while in operations should also be considered. On an annual basis, public transportation providers consume more than 760 million gallons of diesel and gasoline according to the American Public Transportation Association (APTA) [3], which in today’s costs, translates to approximately $2 billion USD per year, assuming a conservative $2.50 USD per gallon of fuel. It should be no surprise that engagement in aggressive driving, which includes speeding, rapid acceleration and braking, leads to lower fuel economy. According to the US Department of Energy, such behavior can lower fuel economy by roughly 10 to 40% [4], resulting in approximately 7.6 – 304 million gallons of fuel or $190 to 760 million USD wasted simply due to poor driving actions.
On the opposite end of the spectrum, vehicle idling can consume anywhere between 0.25 to 0.5 gallons of fuel per hour [4]. Assuming that a vehicle is in service for 50 hours per week and an average idle time of 5 hours, this results in 1.25 to 2.5 gallons of fuel wasted in a week. Extrapolate that to a fleet size of 500 buses and this can cost a transit agency approximately $81,250 to $162,500 USD per year in fuel costs. Further, if we compare this to the total number of buses registered in the U.S., which is 888,907 [1] this results in approximately $140 to 280 million USD wasted on idling vehicles per year.
Driver Support
Considering the many problems highlighted and the associated costs, a majority of these issues are directly related to inefficient use of vehicles. Although transit agencies are required to provide continuous safety and training to their respective staffs, such methods can be further improved upon to lighten the burden on both the transit agency and general public. INIT has developed a software application suite, MOBILE-ECO2, meant to address the very issues described in the above passage. The driver support system acts as an end-to-end solution focused on improving the particular inefficiencies of vehicle use. Provided in the figure below is a generalized system interaction flow focusing on incentivizing efficient use of the vehicle.

The application suite consists of both on-board and off-board system components. Enabling the suite is predominately an effort in installation of software on-board the vehicle and off-board the vehicle in central system servers.
On the vehicle, a telematics computer interfaces with the standard SAE J1939 CAN, Inertial Measurement Unit (IMU) and Global Navigation Satellite System (GNSS) to monitor, analyze, transmit and store key data streams related to vehicle utilization. Key data streams include vehicle speed, engine speed, throttle/gas pedal position %, yaw/turn rate, acceleration rate, fuel consumption, vehicle distance traveled as well as vehicle position, to name a few. In addition to vehicle-use data, identifiers are also stored that allow for association to a particular vehicle, driver, trip, block and route. From these data streams, the on-board computer deploys algorithms to detect, present in real-time to the driver and store the following safety and inefficient vehicle utilization alerts: Harsh Acceleration, Full Throttle, Harsh Braking, Abrupt Turning, Excessive Speeding and Excessive Idling. Such alerts are provided in real-time to the driver on our mobile data terminal as depicted in the figures below.
Upon completion of the trip and return to the garage, the on-board computer will upload the entire trip log, consisting of key data elements recorded every second, along with all the safety and inefficient vehicle utilization alerts detected to off-board systems. The off-board software systems then parse and stores all trip logs from installed vehicles in the fleet in a relational database to support analysis activities, as well as for historical purposes. Upon import into the database, the Driver Support System application provides a web user interface as well as e-mailed reports for transit agency personnel to review how vehicles are being utilized.
Provided in the first figure below is a high-level dashboard report view comparing how the individual garages or contractors within the transit agency are utilizing their vehicles. Key performance indicators such as event distributions, fuel economy and idling time distributions are provided in both graphical and table formats. In the next figure, an in-depth report can be generated which details how individual drivers are performing per garage or contractor. This report allows for transit agency personnel at the respective garage or contractor to understand which drivers are utilizing vehicles in the most safe and effective manner.


Weekly Driver Utilization Report
Case Study: York Region Transit (YRT)
INIT has worked closely with York Region Transit (YRT) to develop, test and roll out MOBILE-ECO2 on all new vehicles, while also working to integrate into later models. Although 100% MOBILE-ECO2 fleet installation and official incorporation into their safety and training programs is ongoing, the data collected has shown promising trends. As demonstrated in the Total Safety Events trend report in the figure below, upon initial introduction to the garages in December 2017, we have seen an average 50% reduction in unsafe and uneconomical vehicle use. Similarly, a reduction of total idling time while on service has also declined per the figure below.
Such trends are bolstered by YRT staff monitoring this data while also communicating with the corresponding garages on improvements that can be made. Further, as described on their website, YRT/Viva's Anti-Idling program aims to further reduce exhaust emissions by restricting buses to a maximum idling time of three minutes. Additional benefits of this program include reduced fuel consumption, maintenance costs and noise impacts [6]. Such a benefit would not be realized if the MOBILE-ECO2 system was not installed on vehicles to provide collection of data, real-time alerts and analytical reports that provide actionable information. More importantly however, the commitment of YRT to ensure that their vehicles are being utilized in an efficient manner based on information provided by MOBILE-ECO2 is of paramount importance to ensure that safer, more efficient management of resources and better driver support can be accomplished.

Ann Derby, INIT, Innovations in Transportation Inc.
Sources:
1. https://www.fmcsa.dot.gov/sites/fmcsa.dot.gov/files/docs/safety/data-and-statistics/81121/2017-pocket-guide-large-truck-and-bus-statistics-final-508c-0001.pdf
2. https://www.nhtsa.gov/press-releases/nhtsa-data-shows-traffic-deaths-77-percent-2015
3. http://www.apta.com/resources/reportsandpublications/Documents/fuel_survey.pdf
4. https://www.fueleconomy.gov/feg/driveHabits.jsp
5. http://www.ipd.anl.gov/anlpubs/2003/03/45815.pdf
6. https://www.yrt.ca/en/riding-with-us/reduce-your-carbon-footprint.aspx
More Management
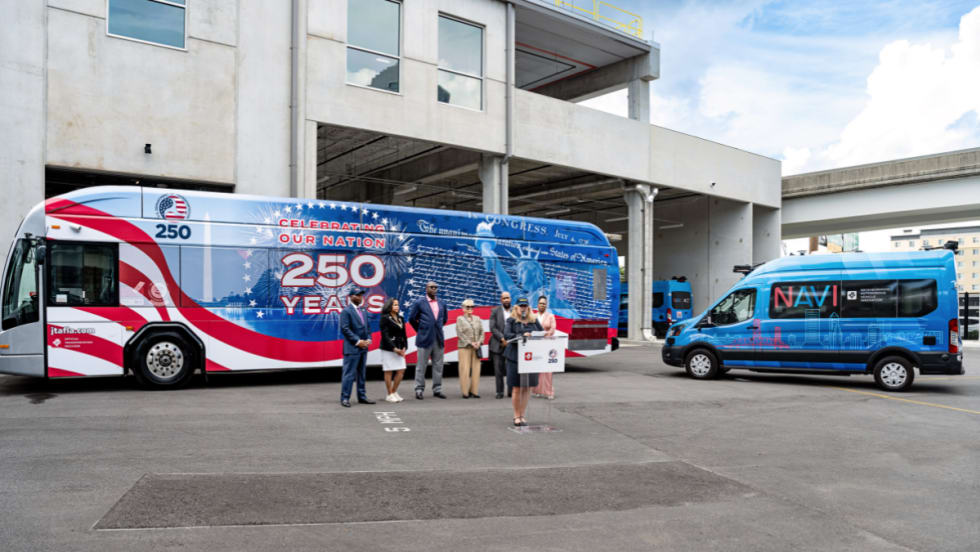
Florida’s JTA Puts Innovation in Motion Ahead of America250
The agency unveiled a commemorative America250 bus during a visit from U.S. DOT's Seval Oz and showcased its autonomous mobility programs.
Read More →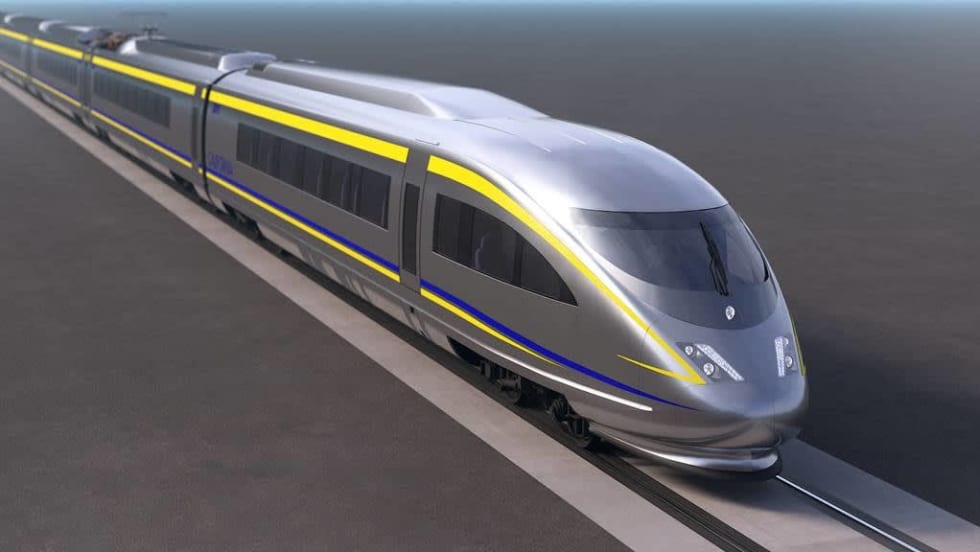
California Selects Team for Nation’s First True High-Speed Rail Track and Systems Contract
The board action follows completion of track installation at the 150-acre southern railhead in Kern County, which will serve as the staging and distribution hub for high-speed track and systems installation.
Read More →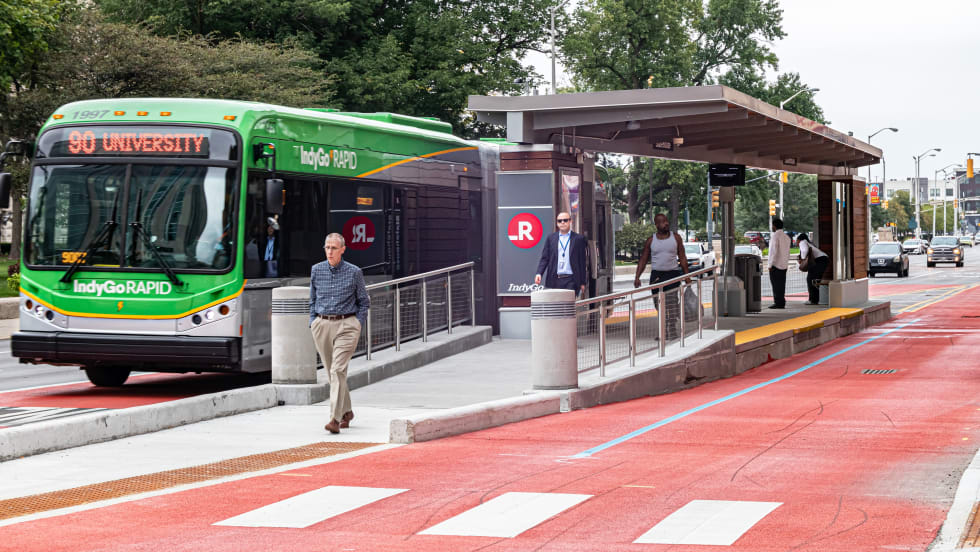
IndyGo, Cleveland RTA Expand Digital Fare Payment Options with Masabi
The new systems combine mobile apps, smart cards, and automatic fare capping to simplify payments, expand flexibility, and help riders access the lowest available fares.
Read More →
Can Better Branding Grow Ridership? Bloomington Transit Bets on a Unified Mobility Experience
See how the Indiana agency aims to simplify transit access through unified trip planning, expanded microtransit, and new payment options.
Read More →
Chicago's NITA Act Moves Into Next Phase as Service Improvements Begin
Rider-focused improvements will begin rolling out across the system immediately as CTA, Metra, and Pace increase service this summer in the six-county region.
Read More →
MBTA Board Approves $10.3 Billion Capital Plan Through 2031
The five-year plan funds more than 660 projects aimed at improving reliability, modernizing infrastructure, and enhancing the rider experience across the MBTA system.
Read More →
Philadelphia's SEPTA Approves Annual Transit Service Plan
Between 2021 and 2024, SEPTA held more than 200 public meetings — including 144 in-person sessions — throughout the SEPTA service region.
Read More →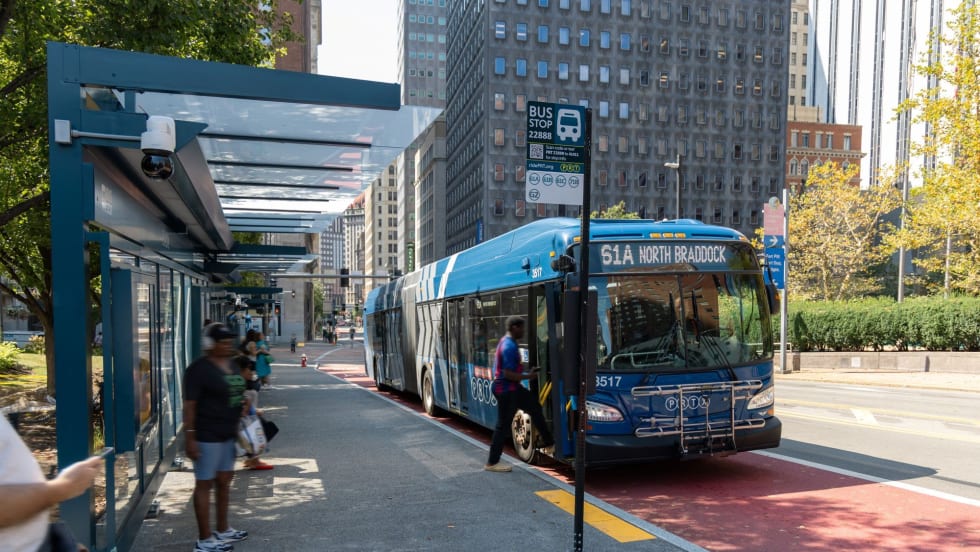
Pittsburgh Approves FY2027 Budget, Warns of Long-Term Funding Challenges
The FY2027 operating budget totals $595.7 million and does not include fare increases or service reductions. To balance the budget, PRT is using $44.8 million in capital funding and $15.4 million in operating reserves.
Read More →
Sponsored•June 1, 2026
Solving Operational Challenges with Next Gen Fleet Management
Delays. Service disruptions. Operator shortages. Today’s transit agencies are under pressure to do more with less. Discover how next-generation fleet management helps agencies overcome operational challenges with real-time visibility, AI-powered tools, cloud-native scalability, and smarter dispatching designed for the future of mobility.
Read More →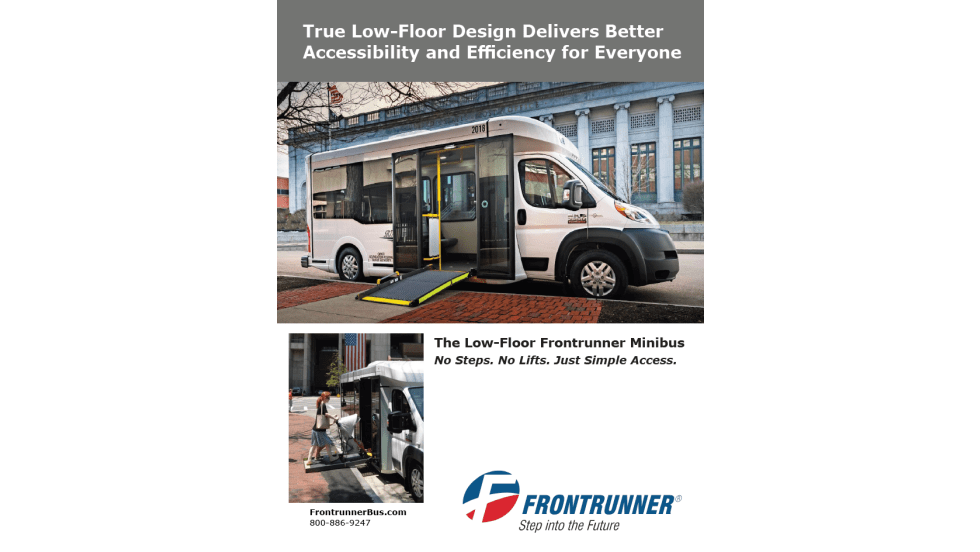
Sponsored•June 1, 2026
A True Low-Floor Minibus Design Delivers Better Accessibility and Efficiency for Everyone
As transit demands evolve, so should your fleet. Download the whitepaper to see how the Low-Floor Frontrunner Minibus compares to traditional options.
Read More →