


Congestion cost Americans nearly $88 billion in 2019, report says
For the second consecutive year, Boston ranked as the most congested city in the U.S.

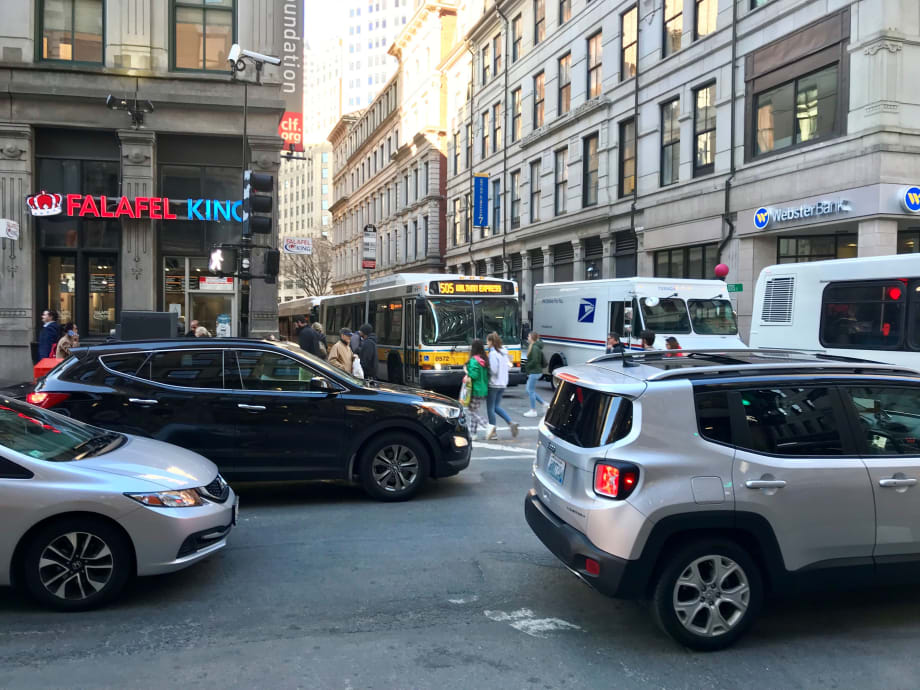
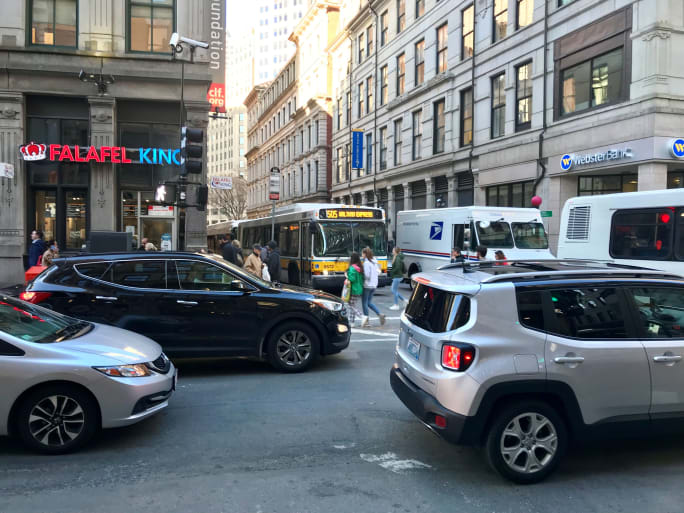
For the second consecutive year, Boston ranked as the most congested city in the U.S. J. Starcic
On average, Americans lost 99 hours a year due to congestion, costing them nearly $88 billion in 2019, an average of $1,377 per year, according to a new report. From 2017 to 2019 the average time lost by American drivers has increased by two hours as economic and urban growth continue nationally.
The 2019 Global Traffic Scorecard, published by INRIX Inc., identified and ranked congestion and mobility trends in more than 900 cities, across 43 countries.
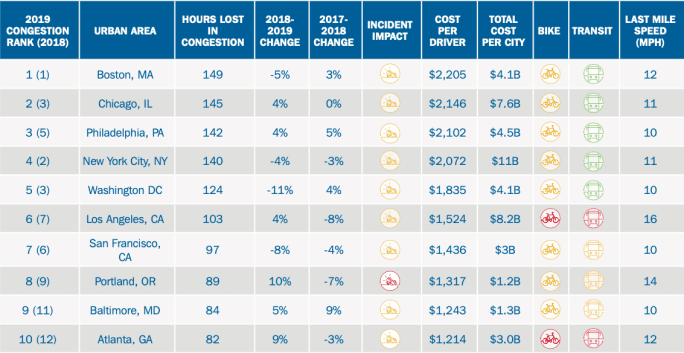
In the U.S., the 2019 Global Traffic Scorecard analyzed congestion and the severity of it in the top 66 urban areas. For the second consecutive year, Boston ranked as the most congested city in the U.S. with the average commuter in the metro area losing 149 hours per year to congestion, costing $2,205 per driver in time lost.
Chicago (145 hours, $2,059 lost), Philadelphia (142 hours, $2,016 lost), New York City (140 hours, $1,988 lost) and Washington, D.C. (124 hours, $1,761 lost) rounded out the Top 5. While known historically for its congestion, Los Angeles’ (ranked sixth in congestion; 103 hours lost in 2019) constant gridlock does not have the severity as the other top-ranked cities due to its sprawling geography and massive road network. On the other hand, Wichita, Kansas, for the second year in a row, had the lowest congestion levels in the U.S. with drivers losing less than two hours a year.
“Congestion costs Americans billions of dollars each year. However, it appears to be stabilizing in some of the country’s most congested metros – with delays raising roughly three percent nationwide since 2017,” said Trevor Reed, transportation analyst at INRIX. “The continued innovation and investment in smarter roadway management is showing early signs of progress. To reflect an increasingly diverse mobility landscape, the 2019 Global Traffic Scorecard includes both public transport and biking metrics for the first time.”
Table 1: 10 Most Congested Urban Areas in the U.S.
The Most Congested Corridors in the U.S.
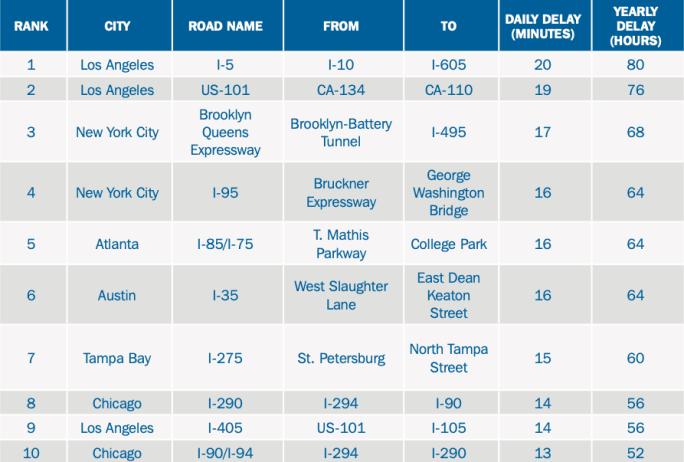
Los Angeles holds the top two worst corridors in the U.S., where drivers on the US-101 and I-5 waste 80 and 76 hours per year at peak hours in congestion, respectively. In each case, the corridor uniquely serves a large geographic area with limited alternatives. In the case of US-101, it cuts through the Hollywood Hills, while I-5 runs diagonally into the downtown core across numerous other highways.
The list of corridors is dominated by the Top 5 most congested cities in the U.S., accounting for seven of the 10 worst. Surprisingly, Tampa Bay’s I-275 comes in at number nine, despite Tampa’s absence on the Top 25 Most Congested Cities list.
Table 2: 10 Most Congested U.S. Roads in 2019
How U.S. Cities Compare to Top Cities Worldwide
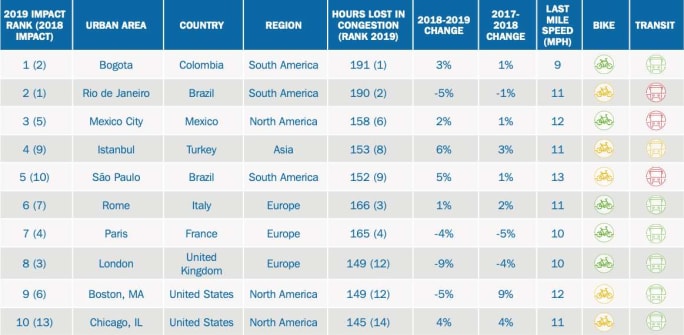
At the global level, Bogota topped the list of the cities most impacted by traffic congestion with drivers losing 191 hours a year to congestion followed by Rio de Janeiro (190 hours), Mexico City (158 hours) and Istanbul (150 hours). Latin American and European cities again dominated the Top 10, highlighting the rapid urbanization occurring in Latin America and cities ill-suited to automobile use in Europe.
Table 3: 10 Most Congested Cities in the World in 2019
Access to reliable data is the first step in tackling congestion. Applying big data to create intelligent transportation systems is key to solving urban mobility problems. INRIX data and analytics on traffic, parking and population movement help city planners and engineers make data-based decisions to prioritize spending in order to maximize benefits and reduce costs now and for the future.
The key findings of the INRIX 2019 Global Traffic Scorecard provide a quantifiable benchmark for governments and cities across the world to measure progress to improve urban mobility and track the impact of spending on smart city initiatives.
More Management

LIT Marks 10-Year Milestone at Annual Summit
Hosted by the COTA from September 10 to 13, the Summit carried the theme “Celebrating 10 Years of Excellence, Leadership, and Impact,” with every part of the program honoring the people, agencies, and partners who built LIT over its first decade.
Read More →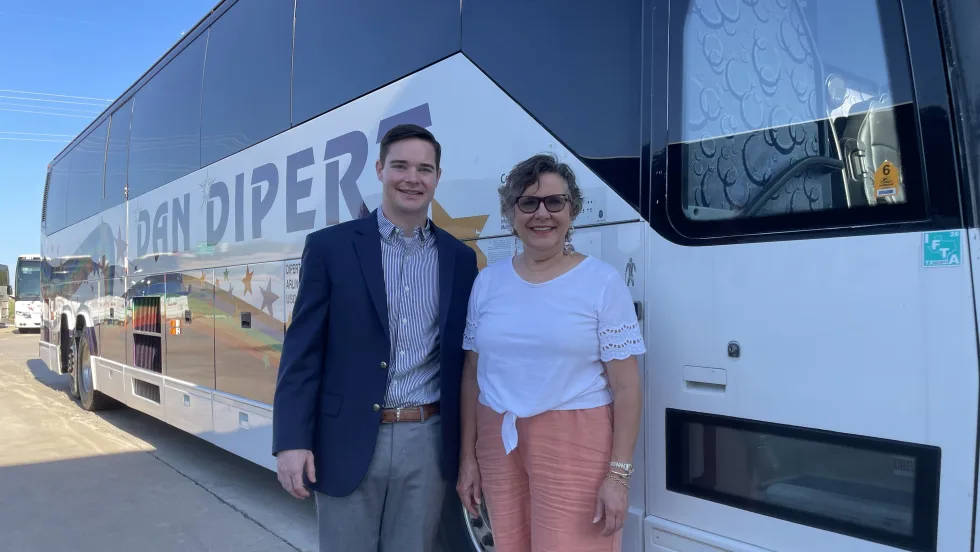
People Movement: Dan Dipert Coaches Adds Third-Generation Leader, Keolis Names New Valley Metro VP/GM, and More
In this edition, we also cover recent appointments and announcements at the Wabtec, SilverRide, HNTB, and more, showcasing the individuals helping to shape the future of transportation.
Read More →
METRO Opens Submissions for 2026 Motorcoach Awards
Nominations are now being accepted for METRO Magazine’s Operator of the Year and Innovative Operator of the Year awards.
Read More →
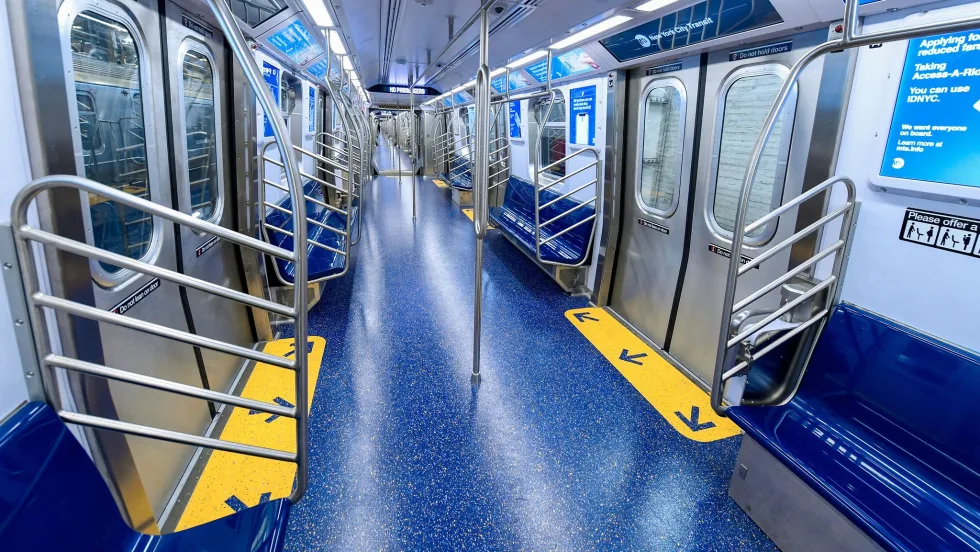
New York MTA Advances Final Contract for Second Avenue Subway Expansion
Contract Four is the largest in the Second Avenue Subway Phase 2 project and includes construction of station infrastructure, tracks, and signals for the subway expansion, MTA officials said. Work on Contract Four will begin in 2027.
Read More →
Transit Agencies Highlight Safety Gains at National Summit
Leaders from 15 major transit systems shared crime-reduction results and safety initiatives while discussing the role of continued federal support.
Read More →
NITA Names New Leadership, Expands Reduced-Fare Program at First Board Meeting
The new regional transit authority appointed its first board chair and interim executive director while extending reduced fares across CTA, Metra, and Pace for eligible riders.
Read More →
Beyond the Checklist: A Structured Approach to Transit Maintenance
Reliability-Centered Maintenance helps transit agencies move beyond routine checklists to focus limited resources on the assets and failures that have the greatest impact on safety, reliability, and service.
Read More →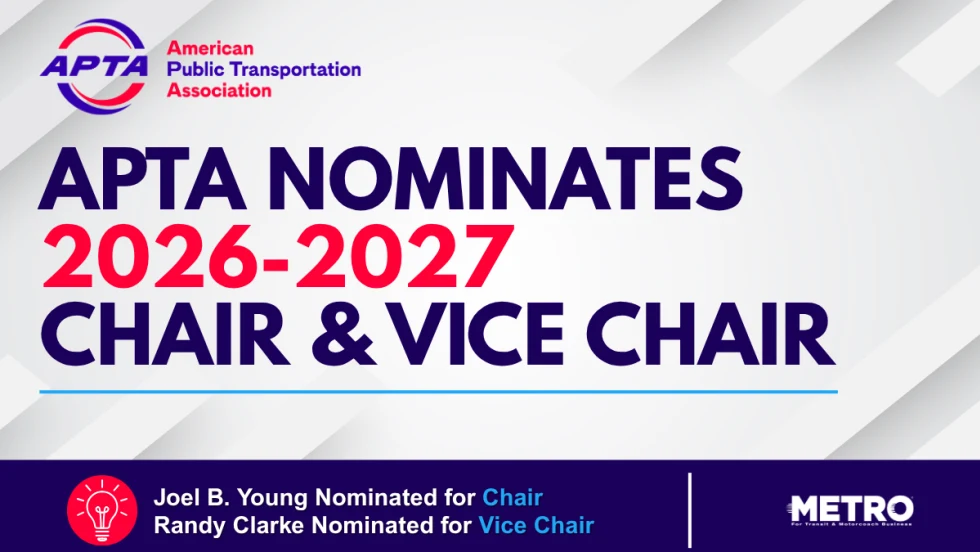
APTA 2026 Nominating Committee Selects Leadership Slate, Names Chair and Vice Chair Nominees
Leadership changes will help shape the association’s priorities and its representation of the transportation industry during the 2026–2027 term.
Read More →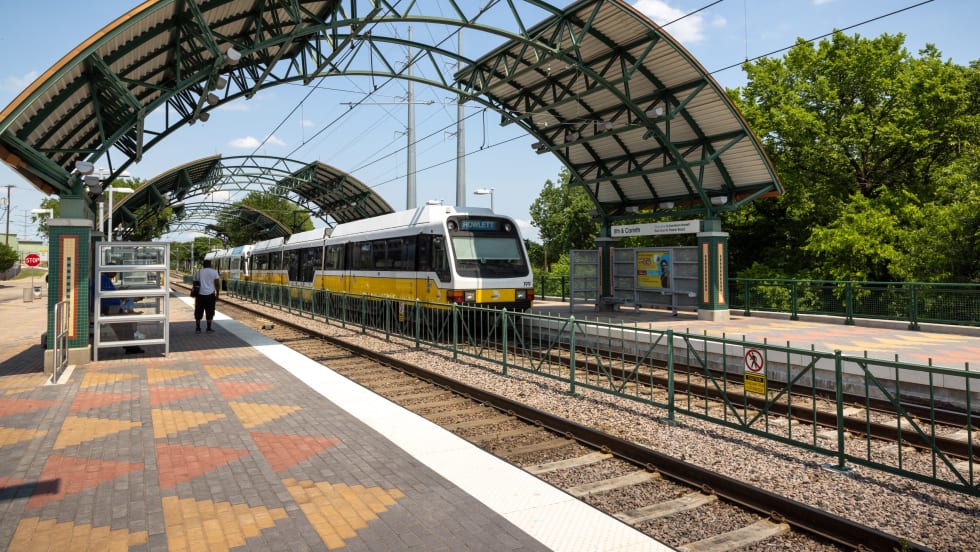
DART Launches Major Security, Fare Enforcement Initiative
The 90-day demonstration will deploy coordinated security teams at five light rail stations while testing controlled access and gathering data to guide future investments.
Read More →
Advancing Fare Collection Through Technology and Innovation
Learn about delivering 1300 gates at 91 stations while managing fare evasion. Explore the large scale deployment, solution customization and real-world results that affect the region. Prepare for deployment in your region now.
Read More →