
Biden Administration Announces Over $368M in Grants to Improve Rail Infrastructure
COVID, Supply Chain Issues Continue to Impact Transit Bus Deliveries
While sales remain down because of COVID-19, supply chain issues, and staffing challenges, zero emission bus sales continue to grow.
by Staff
June 23, 2022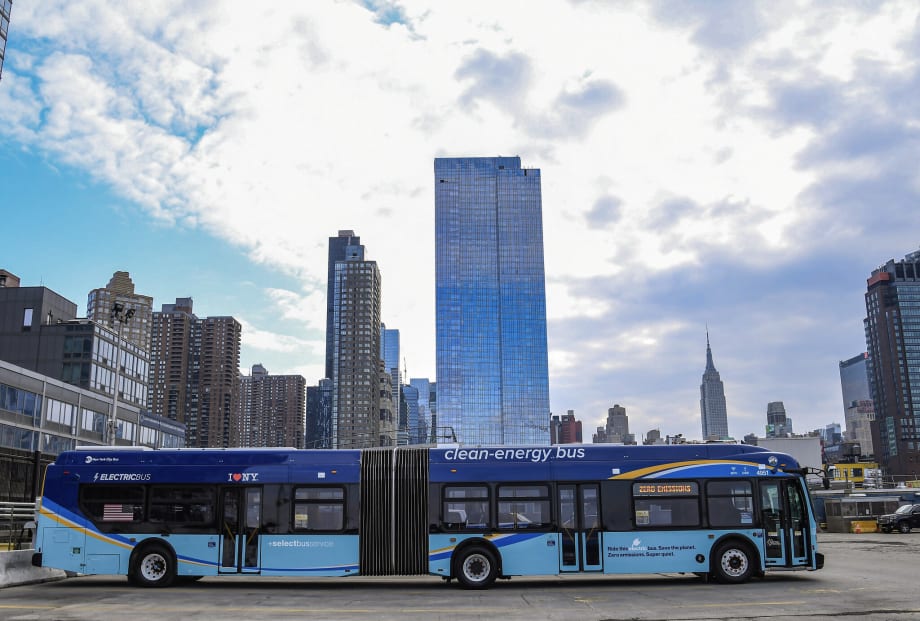
This year is forecasted at a slow improvement path as supply chain challenges linger with 2023 having bus manufacturers and operators girding for a more robust year for deliveries.
Photo: New York MTA
4 min to read
Last year continued to be challenging for both transit agencies and bus manufacturers alike as they navigated through the lingering effects of COVID-19, but more importantly, a significantly challenging supply chain world and staff challenges. The 3% overall market decline looks to be offset by increasing demand with new procurements on the street as well as the highly positive news of secured federal funding for transit from the U.S. federal government for the next five years.
This year is forecasted at a slow improvement path as supply chain challenges linger with 2023 having bus manufacturers and operators girding for a more robust year for deliveries. Alternate-fueled vehicles do not show signs of abating in demand and the trending up for this propulsion type and the trending down for diesel will continue for the foreseeable future.
Overall Market Assessment
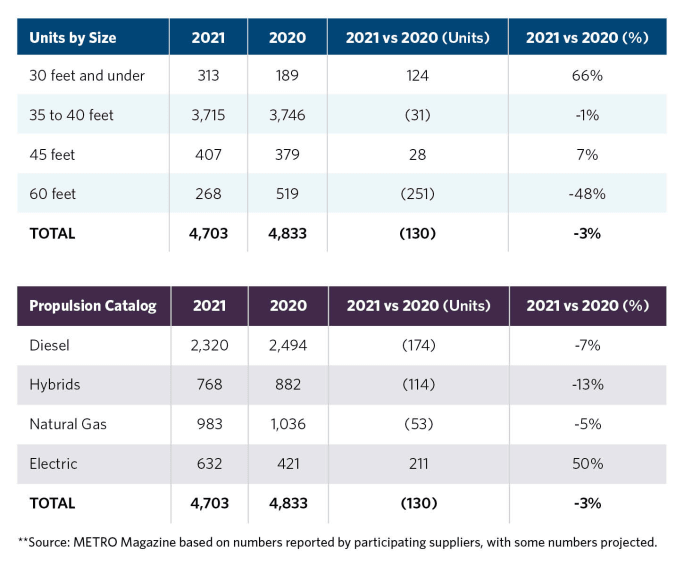
• 2021 vs 2020 overall transit bus production declined for a second consecutive year by 3% from 4,833 units in 2020 to 4,703 units in 2021. Production in 2019 was 6,320 units and thus the market is delivering only 74% of pre-pandemic units into the market.
• Primary reasons for the decline were challenges with supply chain materials where production plants were idled or slowed intermittently in 2021; the lingering effects of COVID-19 with manufacturing plant workers; and keeping plants open consistently together with worker retention. These factors created significant difficulty for the bus OEMs to produce efficiently and on schedule in 2021.
• Despite the lower production output in 2021, customer demand (i.e. bid volume) remains robust through 2021 with new bid activity at its highest levels since 2017. This bodes well for future periods with a prediction of returning to pre-COVID output levels within the next 12 to 18 months.
• It is anticipated that supply chain challenges will continue to hamper production output through the balance of 2022. This will yield a slow increase in production output in 2022 with 2023 looking to be the year when we return to more normal production and delivery volumes.
Assessment from a Vehicle Length Segmentation Perspective
• Thirty-foot and under units experienced a significant increase of 66% from 189 units in 2020 to 313 units in 2021.
• 35- to 40-foot units experienced a very minor reduction of 1% from 3,746 units in 2020 to 3,715 units in 2021.
• 45-foot units experienced a favorable increase of 7% from 379 units 2020 to 407 units in 2021.
• 60-foot units experienced a second consecutive year of erosion of 48% from 519 units in 2020 to 268 units in 2021. Unit output in 2019 was 771 units, and thus, 2021 data represents a 65% decrease over the two-year period.
The year-over-year changes show the 35- to 40-foot segment and the 45-foot segment remain relatively stable in terms of percentage of the overall total, with the former at 79% of overall volume and the latter at 9% of the overall volume. The most significant changes in length mix in 2021 vs 2020 came from the increase in 30-foot models and the decline of the 60-foot volume. The one area to watch is the 60-foot volume decrease as this segment is exhibiting two years of significant decrease.
Assessment from a Propulsion Segmentation Perspective
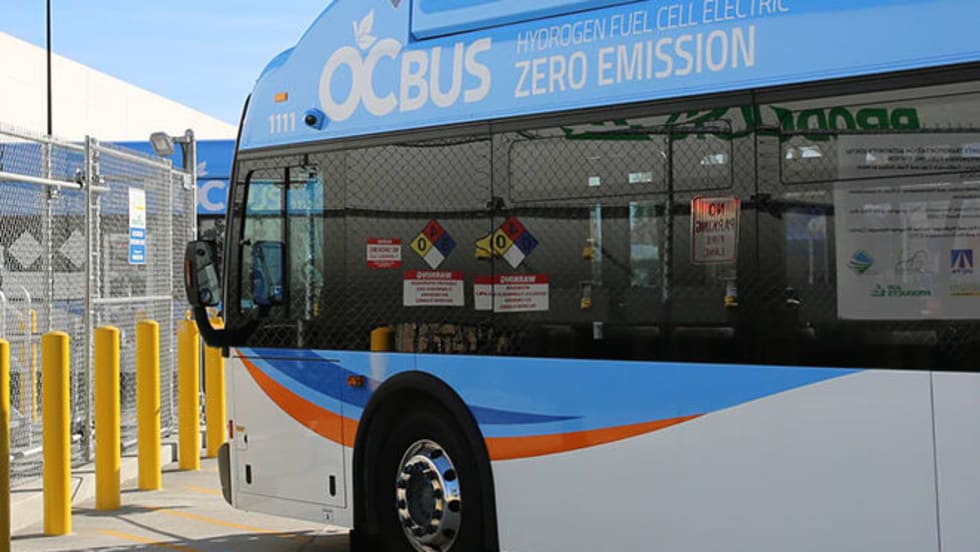
• Electric propulsion vehicles exhibited the most dramatic increase year-over-year with a 50% jump from 421 units in 2020 to 632 units in 2021. The 2021 volumes represented 13% of the overall output up from 9% in 2020 showing the continued strong demand for electric vehicles. One important note is that this year’s electric vehicle numbers include hydrogen fuel-cell vehicles.
• Diesel propulsion continues to maintain the majority of market demand but has slipped to now 49% of the overall market. This is the first time that diesel vehicles have been less than 50% of the market. Year-over-year diesel output declined by 7% from 2,494 units in 2020 to 2,320 units in 2021.
• Trolley and fuel-cell electric propulsion showed no units in 2021 which was consistent with 2020.
• Natural gas-powered vehicles exhibited a 5% decline from 1,036 units in 2020 to 983 units in 2021.
• Hybrid propulsion saw a 13% decline from 882 units in 2020 to 768 units in 2021. In 2019, hybrid volume was 1,067 units.
The year-over-year propulsion mix can be summarized by the fact that the overall market reduction from 2020 to 2021 came at the expense of diesel and hybrid vehicles with their share of the overall market at 49% and 16% respectively. NGV output remained at 21% of the overall volume in 2021, which was identical to 2020 and electric vehicles jumped to 13% of the overall volume from 9% in 2020. As noted prior, 2021 marks the first year were alternate fueled vehicles garnered the majority of deliveries at 51% vs 49% for diesel.
METRO would like to thank all our suppliers for taking part again in this year’s survey.
Subscribe to Our Newsletter
More Bus
Biz Briefs: OCTA Taps Clean Energy for Hydrogen Station, Stadler to Supply Via Rail Vehicles, and More
From manufacturers and suppliers to transit agencies and motorcoach operators, these updates offer a snapshot of the projects, partnerships and business moves driving the industry forward.
Read More →
METRO Magazine Announces 2026 Innovative Solutions Awards Winners
Projects Recognized for Advancing Mobility Through Technology, Accessibility, Workforce Innovation, and Operational Excellence
Read More →Biz Briefs: STV teams with Amtrak, Motorcoach Operators Boost Fleet and Land Contracts, and More
From manufacturers and suppliers to transit agencies and motorcoach operators, these updates offer a snapshot of the projects, partnerships and business moves driving the industry forward.
Read More →
LA Metro Marks Banner Year, Sets Ambitious Goals for New Fiscal Year
Incoming LA Metro Board Chair and Los Angeles Mayor Karen Bass joined outgoing Board Chair Fernando Dutra and LA Metro CEO Stephanie Wiggins to review accomplishments from fiscal year 2026, which included the opening of new rail extensions, advancement of major transit projects, expanded safety programs, and new rider amenities.
Read More →
DART Taps Nathaniel P. Ford Sr. as Next President/CEO
Since 2012, Ford has served as the CEO of the Jacksonville Transportation Authority
Read More →
AC Transit’s Cecil Blandon on Building the Next Generation of Transit Maintenance Leaders
The agency’s maintenance chief discusses leadership, workforce development, zero-emission technology, and preparing technicians for the future of public transportation.
Read More →
Building the Next Generation of Transit Technology
In this edition of METROspectives, Luminator CEO Magnus Friberg discusses the company's transformation, the growing role of AI and software, and what's next for transit technology.
Read More →
June LA Metro Ridership Surges 2 Million Year Over Year
Total June ridership increased for both weekdays and weekends. Weekday ridership was 953,820, which grew 8.4% from June 2025; Saturdays increased nearly 13% year-over-year to 708,826; and Sundays increased 7.7% to 611,534 from June 2025, according to LA Metro.
Read More →
Washington's Pierce Transit Board Sends Transit Funding Measure to November Ballot
With the adoption of Resolution 2026-006, the measure moves to the Pierce County Auditor, giving voters in the Pierce Transit service area the decision on whether to fund an expansion of local transit service within the agency’s service area.
Read More →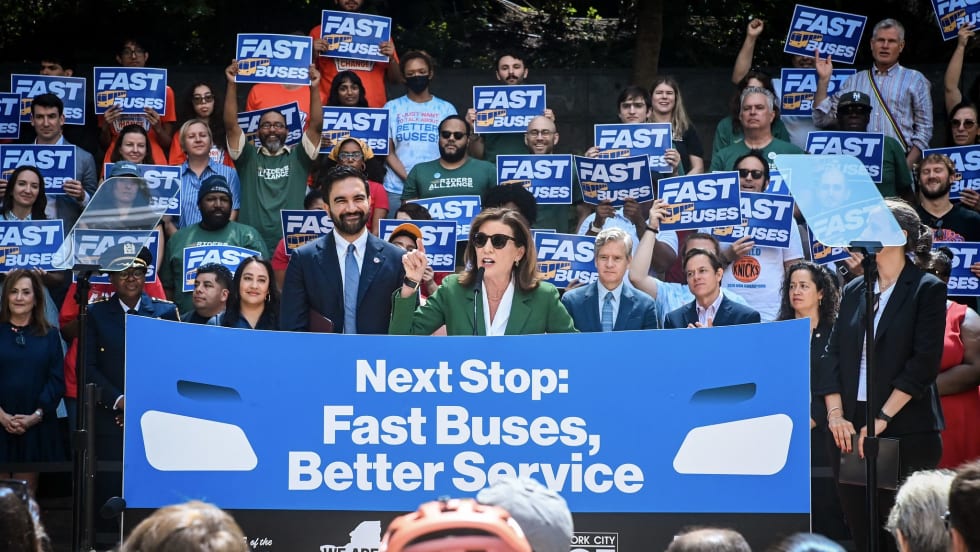
New York Unveils Sweeping Plan to Modernize City Bus Service
Next Stop: Fast Buses, Better Service identifies 50 priority bus corridors for improvements across the five boroughs and launches the City’s next generation of rapid bus service along five key routes.
Read More →