
Researchers Identify Top Risk Factors for Pedestrian-vehicle Crashes at Massachusetts Bus Stops
While their comprehensive analysis of bus stops focused on Massachusetts, the researchers are excited about the generalizability of the findings and application to other locations.

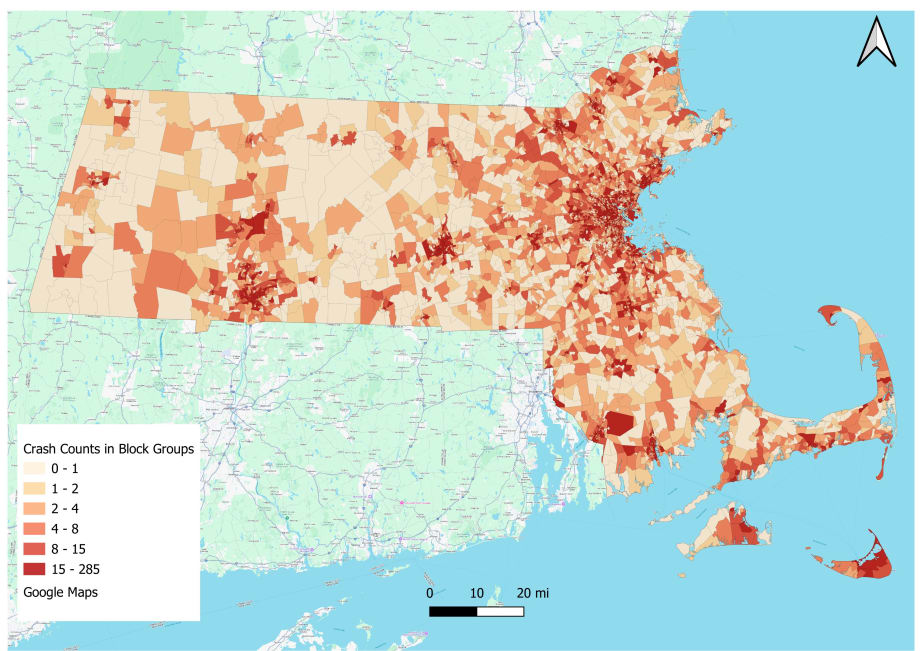
Pedestrian-vehicle crashes A 300-foot view from a bus stop in Massachusetts from 2016-2024.
Credit: University of Massachusetts Amherst
With pedestrian fatalities, particularly in public transit areas, continuing to rise across the country, researchers at the University of Massachusetts Amherst have determined the top risk factors of pedestrian-vehicle crashes at bus stops to recommend potential solutions.
While their comprehensive analysis of bus stops focused on Massachusetts, the researchers are excited about the generalizability of the findings and application to other locations.
“Despite significant advances in road design over the past decade to enhance safety, we are still seeing safety issues that are disproportionately impacting pedestrians,” said Tolu Oke, lead study author and a Ph.D. candidate in transportation engineering at UMass Amherst.
Study Overview
Since the pandemic, bus ridership across the U.S. has recovered more significantly than other forms of public transit, reaching 86% of pre-pandemic levels by 2025. Previous research shows that 46% of pedestrian crashes in Massachusetts occur near bus stops.
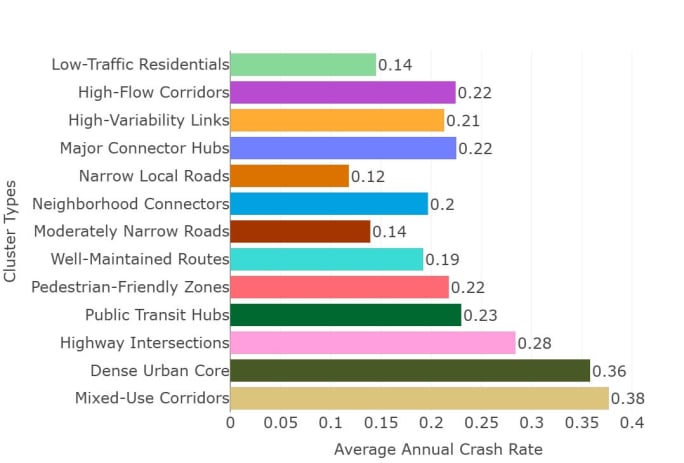
Average annual crash rate by bus stop type.
Credit: University of Massachusetts Amherst
“Is this the chicken or the egg?” said Michael Knodler, the William W. Boyer Endowed Professor of Engineering in the Riccio College of Engineering at UMass Amherst, director of the UMass Transportation Center, and one of the authors of the paper. “Are the crashes happening there because that’s where the pedestrians are, or is there something about the particular aspects of bus stop design or placement contributing to the pedestrian risk?”
Oke and her team used machine learning-based factor analysis to examine 1,773 such stops, ultimately determining 13 crash-relevant characteristics that cluster into 13 distinct bus stop types ranging from stops on remote rural roads to densely packed urban streets.
The 13 characteristics can be organized into three categories: first, the immediate-environment factors. This includes bus stop infrastructure, road condition, road width, crossing difficulty, or crossing safety. Second are network integration and connectivity factors: Interstate highways, principal or minor arterials, or major or minor connectors.
And finally, there are sociodemographic and land-use contexts that describe the characteristics of the community and area the stop serves, such as core density and social advantage or social equity. Unique clusters of these factors make up the 13 distinct bus stop types.
U. of Amherst Findings
The two bus stop types with the highest crash prevalence across all clusters are in “mixed-use arterial corridors” and “dense urban cores.”
While slightly different in their makeup, both are complex environments characterized by high traffic volumes, multiple modes of transportation, and a mix of properties, including apartments, stores, and parks.
“All the activity in these areas just provides more opportunity for conflict,” said Oke.
Based on the mix of characteristics, the researchers proposed recommendations specific to each bus stop type. “We can’t apply the same safety solution everywhere,” said Oke. “Our research shows that different areas have different crash problems. In one area, the solution might be the addition of a crosswalk, while on a dense, multimodal corridor, we may need protective features to separate and calm the complex interaction of pedestrians, cyclists, cars, and buses.”
Some countermeasures aim to slow drivers down, not because they will reduce the number of crashes, but because they will make those that occur less deadly.
“The overwhelming countermeasure is speed,” Knodler added. “Whenever you have these potential conflicts, managing the speeds across the different modes is the key. If a pedestrian is hit by a driver in a car going over 40 miles an hour, there’s an 80% probability that that pedestrian is seriously injured or killed. If that speed is 20 miles an hour, it’s less than 20% chance that that pedestrian is seriously injured or killed.”
The full list of the UMass Amherst study’s characteristics, bus stop types descriptions, and proposed countermeasures can be found at Data Science for Transportation.
More Security and Safety
FTA Launches 'Transit Moves America' Dashboard to Highlight Agency Safety and Performance
The online dashboard transforms National Transit Database information into a public-facing resource that allows users to compare transit agencies on key operational and safety metrics.
Read More →
LA Metro Marks Banner Year, Sets Ambitious Goals for New Fiscal Year
Incoming LA Metro Board Chair and Los Angeles Mayor Karen Bass joined outgoing Board Chair Fernando Dutra and LA Metro CEO Stephanie Wiggins to review accomplishments from fiscal year 2026, which included the opening of new rail extensions, advancement of major transit projects, expanded safety programs, and new rider amenities.
Read More →
Building the Next Generation of Transit Technology
In this edition of METROspectives, Luminator CEO Magnus Friberg discusses the company's transformation, the growing role of AI and software, and what's next for transit technology.
Read More →
TTC Launches Camera Pilot to Curb Illegal Passing of Streetcars
During the pilot, the cameras will measure how often illegal streetcar passing occurs and test the technology's reliability for future automated enforcement.
Read More →
Biz Briefs: Masabi Teams with St. Louis Metro and More
In METRO's latest installment, we take a look at recent news from Transdev, Hitachi, and more partnerships making headlines across the transportation sector.
Read More →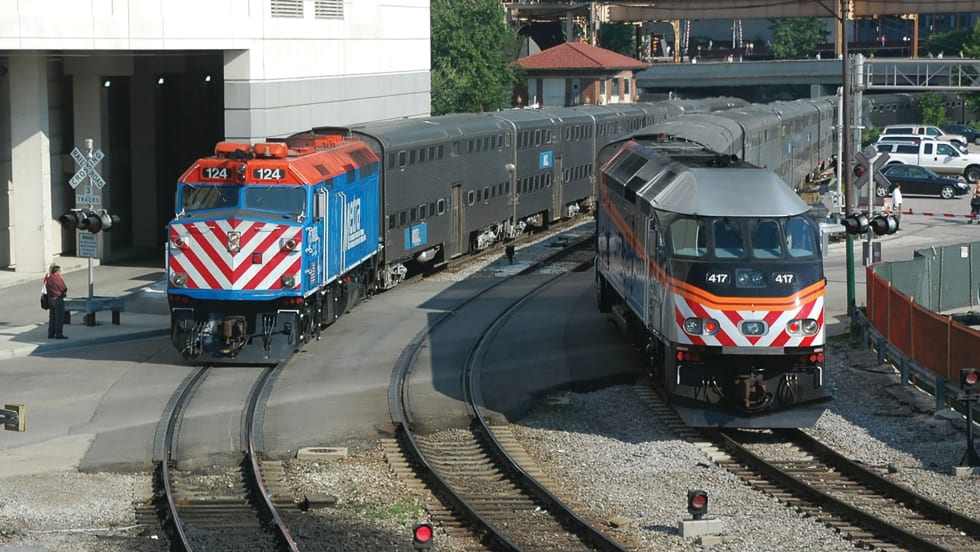
Metra Begins Drone Pilot Project to Boost Safety and Security
The project is funded through a $620,000 grant from FEMA’s Transit Security Grant Program, which provides transit agencies with funding for projects intended to protect critical transportation infrastructure and the traveling public.
Read More →
Building the Next Generation of Transit Technology
In this edition of METROspectives, Luminator CEO Magnus Friberg discusses the company's transformation, the growing role of AI and software, and what's next for transit technology.
Read More →
APTA Recognizes Excellence in Rail Safety and Security at 2026 Rail Conference
Nominations are evaluated on four criteria: effectiveness, benefit level, innovation, and transferability.
Read More →
Biz Briefs: Endera Delivers to California, Safety Vision Teams with San Antonio's VIA, and More
From manufacturers and suppliers to transit agencies and motorcoach operators, these updates offer a snapshot of the projects, partnerships and business moves driving the industry forward.
Read More →
The Role of AI in Public Safety for Smart Transit Systems
As transit systems generate more data than ever, AI-powered safety tools are helping agencies detect incidents faster, improve response times and enhance situational awareness.
Read More →