
WMATA Upgrades Ridership Data Portal
The portal now includes a combined look at rail and bus ridership, adds no-tap rail ridership to the rail dashboard to track the effectiveness of anti-fare evasion efforts, and provides a more complete picture of total ridership.

Some of the trends WMATA riders can look at in the portal include the changing commute patterns, growing weekend ridership, ridership on popular holidays like the Fourth of July, and the busiest day in recent WMATA history.
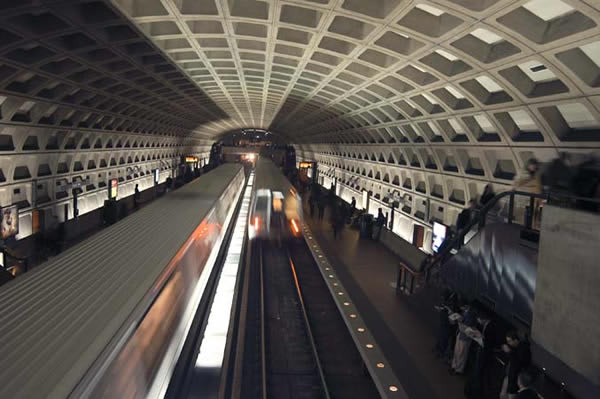
Photo: Larry Levine
The Washington Metropolitan Area Transit Authority (WMATA) ridership data portal now includes a combined look at rail and bus ridership, adds no-tap rail ridership to the rail dashboard to track the effectiveness of anti-fare evasion efforts, and provides a more complete picture of total ridership. It also includes Metrobus ridership data based on passenger counting devices on board the vehicles to better account for total ridership.
All data is downloadable for independent analysis.
WMATA’s Ridership Data Portal
The ridership data portal was launched in 2019 to give customers, journalists, jurisdictional staff, researchers, the business community, and other stakeholders access to data about WMATA’s ridership patterns. Providing open data also promotes transparency and accountability.
Some of the trends riders can look at in the portal include the changing commute patterns, growing weekend ridership, ridership on popular holidays like the Fourth of July, and the busiest day in recent WMATA history.
Riders can also look at where their home station ranks in ridership among other stations. The agency is also developing a ridership dashboard for MetroAccess in the coming months.
WMATA’s Focus on Ridership
The agency’s data portal update comes on the heels of an announcement in January that customers can now visit a new website to get a personalized report of their ridership for an entire year.
The new website, called “Your 2023 Metro” report, gives riders detailed information about their use of public transit last year including:
Number of bus and rail trips.
Number of stations visited.
Miles they traveled on transit.
Most used bus route.
How much carbon dioxide emissions they saved by taking transit instead of driving or ride-hailing.
How they rank against other WMATA riders.
“We know how much value transit brings to the region and the lives of our customers and this new tool will give riders a tangible idea of how much they used Metro in 2023,” said WMATA’s GM/CEO Randy Clarke. “Every time you choose to take transit over driving, you're helping the DMV region to make strides toward our climate and safety goals and you’re saving time by not sitting in traffic.”
Clarke added that he hoped the stats bring some friendly competition to social media, too, and that he ranks in the top 1% of WMATA riders in 2023.
More Management

What Transit-Oriented Development Means for the Future of Public Transportation
Once viewed primarily as transit operators, agencies are now leveraging land, partnerships, and long-term planning to boost ridership, expand housing, and strengthen communities.
Read More →
USDOT Announces $22 Million for Transit Innovation, Updates High-Speed Rail Rules
New federal transit funding will support safety, accessibility, and technology projects as updated rail regulations establish new noise standards for high-speed trains.
Read More →
Transportation Construction Coalition Unveils Infrastructure Case Studies Ahead of Federal Funding Deadline
The coalition noted the next surface transportation bill should provide sustained investment in highways and public transit to strengthen freight movement, improve safety, and support economic growth.
Read More →
People Movement: American Bus Association Extends Ferguson and More
METRO’s People Movement highlights the latest leadership changes, promotions, and personnel news across the public transit, motorcoach, and people mobility sectors.
Read More →
METRO Magazine Announces 2026 Innovative Solutions Awards Winners
Projects Recognized for Advancing Mobility Through Technology, Accessibility, Workforce Innovation, and Operational Excellence
Read More →
MBTA Rolls Out Pilot Programs to Cut Costs, Simplify Travel
Three new fare pilots — including unlimited two-hour transfers, reduced express bus fares, and free transit for eligible seniors — will launch this fall as Massachusetts extends popular commuter rail discounts through November.
Read More →
FTA Opens $610 Million Funding Opportunity for Bus Infrastructure Projects
The latest Notice of Funding Opportunity provides transit agencies with funding for bus facilities, fleet modernization, and low- and no-emission vehicles, with applications due September 21.
Read More →Biz Briefs: STV teams with Amtrak, Motorcoach Operators Boost Fleet and Land Contracts, and More
From manufacturers and suppliers to transit agencies and motorcoach operators, these updates offer a snapshot of the projects, partnerships and business moves driving the industry forward.
Read More →
Massachusetts Approves $530M to Strengthen MBTA Operations, Infrastructure
The funding package targets operating stability, capital improvements, and fare affordability, offering a model for agencies navigating long-term funding challenges.
Read More →
LA Metro Marks Banner Year, Sets Ambitious Goals for New Fiscal Year
Incoming LA Metro Board Chair and Los Angeles Mayor Karen Bass joined outgoing Board Chair Fernando Dutra and LA Metro CEO Stephanie Wiggins to review accomplishments from fiscal year 2026, which included the opening of new rail extensions, advancement of major transit projects, expanded safety programs, and new rider amenities.
Read More →