
2013 Top 100 Transit Bus Fleets: Innovate with Tech, Green Vehicles
Alternatively-propelled vehicles total 16,434 and make up 25% of the fleet totals reported for 2013, with natural gas leading the way.
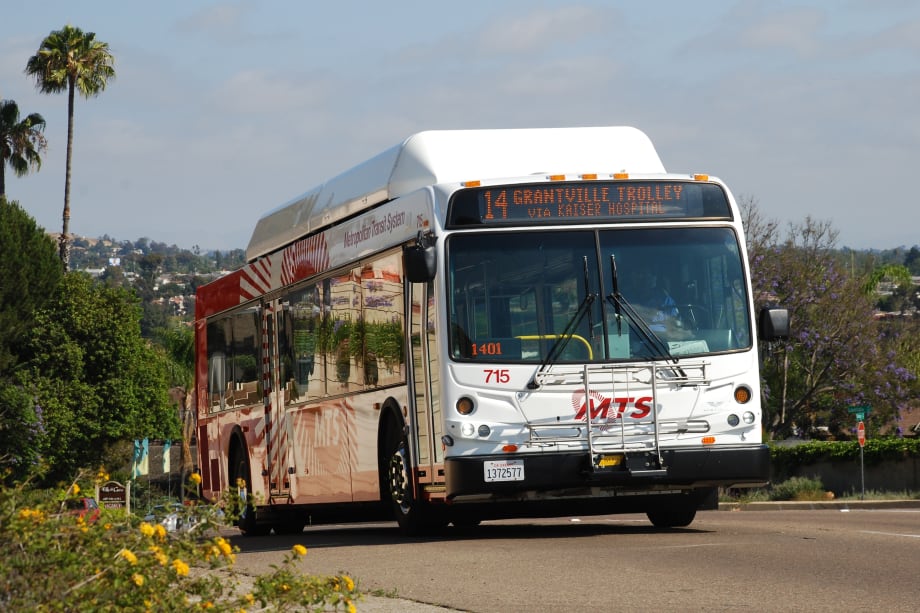

With 58% of transit agencies reporting they are having issues with funding for operations, this year’s 65,461 total vehicles is up slightly — 124 vehicles — compared to 2012, according to respondents to METRO’s Top 100 Transit Bus Fleets survey.
New York City Transit holds the top spot with a total 4,426 vehicles, while New Jersey Transit (2,416), the Los Angeles County Metropolitan Transportation Authority (2,370), the Toronto Transit Commission (1,882) and the Chicago Transit Authority (1,870) round out the top five.
Making changes, adding tech
As funding issues persist for transit agencies, many look to implement new initiatives to enhance their services. Albuquerque’s ABQ Ride (No. 86) created a real-time bus location app for iPhone and will soon release a companion for Android. It also completed a four-year, American Recovery and Reinvestment Act-funded project to install 414 bus shelters.
In Tennessee, the Memphis Area Transit Authority (No. 90) installed an automatic vehicle locator system and new security cameras on all revenue vehicles, vehicle health monitoring devices on all buses and bicycle racks, and automatic passenger counters and automatic voice annunciators on all fixed-route buses. The agency also installed signage showing real-time passenger information at all transit centers and trolley stops.
Meanwhile, to help make up for funding issues, many of this year’s respondents continue to redesign routes to enhance optimization and work with state and local officials to develop long-term tax revenue solutions as well as make the unpopular decisions to raise fares, cut service and downsize staff.
The numbers
A closer look at the numbers reveals 47,239 buses are 35 feet or longer, making up 72% of the total vehicles reported, with 12,774, or 19.5%, of vehicles 35 feet and under. Fifty-seven percent, or 37, 539, of the total vehicles are low-floor applications and 10% are used for demand response. This year’s Top 10 makes up 34% of the Top 100 Bus Fleet totals, remaining steady compared to 2012. Overall, this year’s respondents report that they intend to order 5,933 vehicles in the next year, up 1% from last year’s number.
Meanwhile, alternatively-propelled vehicles total 16,434 and make up 25% of the fleet totals reported for 2013, with natural gas leading the way. Additionally, three out of five respondents say they are interested in exploring natural gas. Hybrid-electric vehicles made a big leap in 2013, going from just over 4,500 vehicles in 2012 to 6,824 this year, or 41.5% of the total alternatively-propelled vehicles reported. Less than 1% of fleets are comprised of hydrogen or propane-fueled vehicles.
Digging a bit deeper, 16 transit agencies in this year’s Top 100 are from Canada, with seven cracking the top 20. Meanwhile, California (15), New York (nine) and Texas (six) make up the three states with the most representation.
With budget and staff cuts across the nation, METRO would especially like to thank all of the transit agencies for participating this year. If you know a fleet that belongs on this list or have suggestions on how to improve our future lists, please let us know.
To view the Top 100, click here.
More Bus
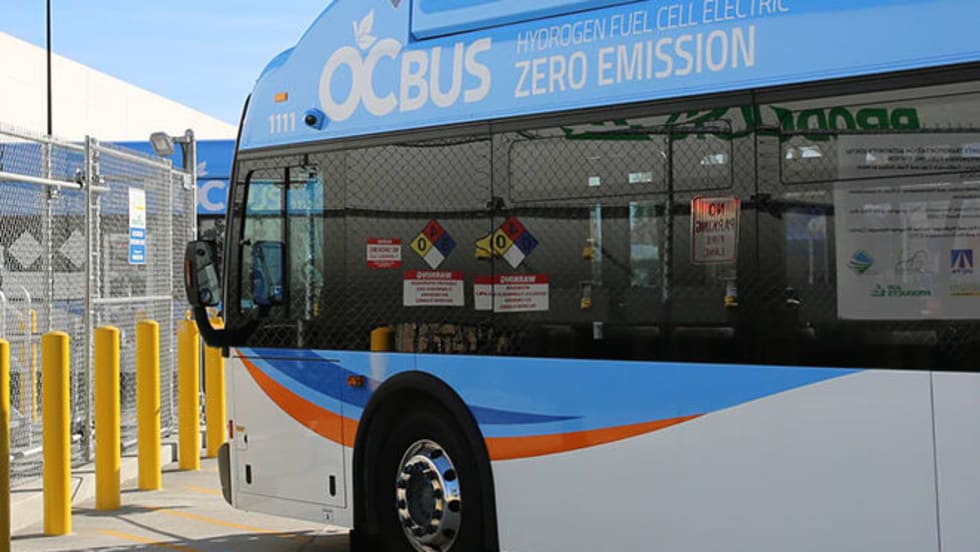
Biz Briefs: OCTA Taps Clean Energy for Hydrogen Station, Stadler to Supply Via Rail Vehicles, and More
From manufacturers and suppliers to transit agencies and motorcoach operators, these updates offer a snapshot of the projects, partnerships and business moves driving the industry forward.
Read More →
METRO Magazine Announces 2026 Innovative Solutions Awards Winners
Projects Recognized for Advancing Mobility Through Technology, Accessibility, Workforce Innovation, and Operational Excellence
Read More →Biz Briefs: STV teams with Amtrak, Motorcoach Operators Boost Fleet and Land Contracts, and More
From manufacturers and suppliers to transit agencies and motorcoach operators, these updates offer a snapshot of the projects, partnerships and business moves driving the industry forward.
Read More →
LA Metro Marks Banner Year, Sets Ambitious Goals for New Fiscal Year
Incoming LA Metro Board Chair and Los Angeles Mayor Karen Bass joined outgoing Board Chair Fernando Dutra and LA Metro CEO Stephanie Wiggins to review accomplishments from fiscal year 2026, which included the opening of new rail extensions, advancement of major transit projects, expanded safety programs, and new rider amenities.
Read More →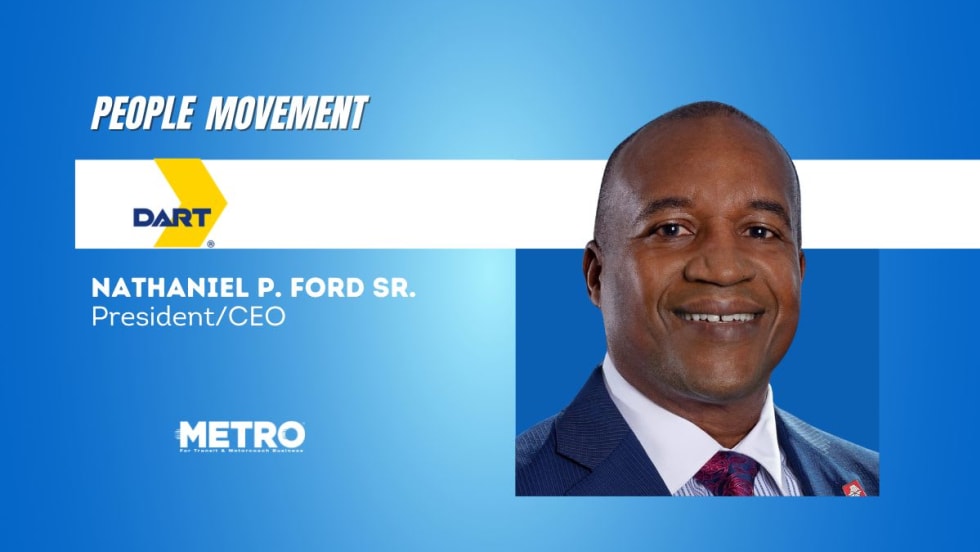
DART Taps Nathaniel P. Ford Sr. as Next President/CEO
Since 2012, Ford has served as the CEO of the Jacksonville Transportation Authority
Read More →
AC Transit’s Cecil Blandon on Building the Next Generation of Transit Maintenance Leaders
The agency’s maintenance chief discusses leadership, workforce development, zero-emission technology, and preparing technicians for the future of public transportation.
Read More →
Building the Next Generation of Transit Technology
In this edition of METROspectives, Luminator CEO Magnus Friberg discusses the company's transformation, the growing role of AI and software, and what's next for transit technology.
Read More →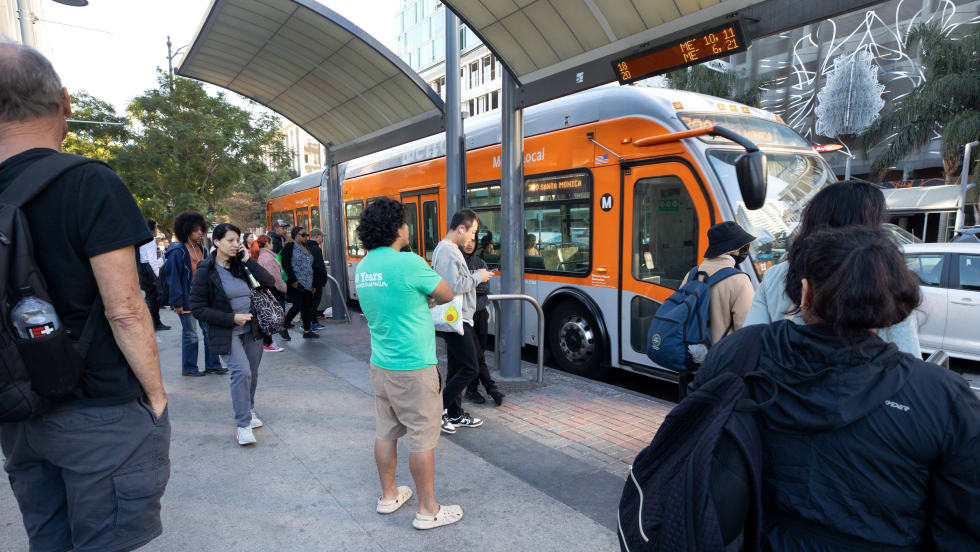
June LA Metro Ridership Surges 2 Million Year Over Year
Total June ridership increased for both weekdays and weekends. Weekday ridership was 953,820, which grew 8.4% from June 2025; Saturdays increased nearly 13% year-over-year to 708,826; and Sundays increased 7.7% to 611,534 from June 2025, according to LA Metro.
Read More →
Washington's Pierce Transit Board Sends Transit Funding Measure to November Ballot
With the adoption of Resolution 2026-006, the measure moves to the Pierce County Auditor, giving voters in the Pierce Transit service area the decision on whether to fund an expansion of local transit service within the agency’s service area.
Read More →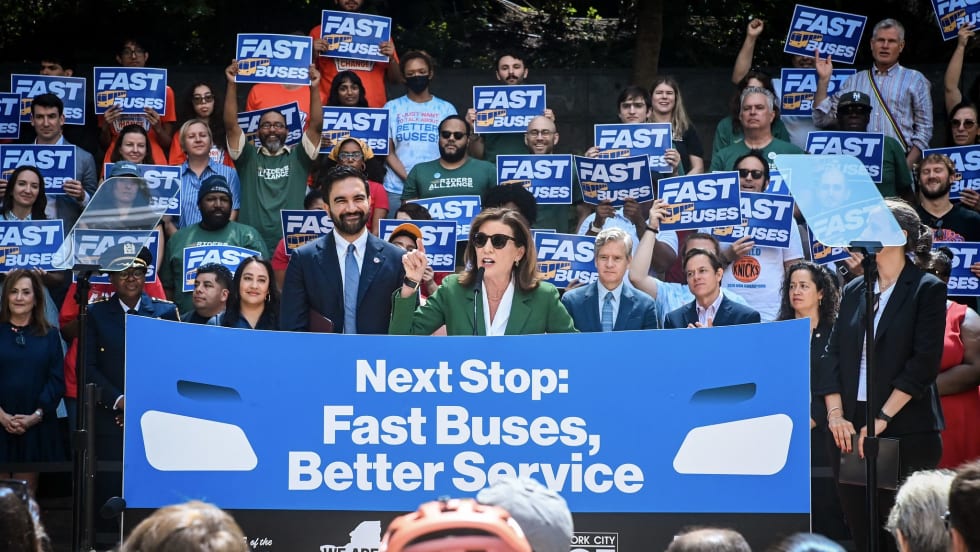
New York Unveils Sweeping Plan to Modernize City Bus Service
Next Stop: Fast Buses, Better Service identifies 50 priority bus corridors for improvements across the five boroughs and launches the City’s next generation of rapid bus service along five key routes.
Read More →