
FIVE MUSTS
Essential elements for acceptable on-time performance:
1. Adequate and accurate running times between timepoints (including adequate pullout deadhead times)
2. Adequate recovery time
3. Enough trained, qualified vehicle operators
4. Enough equipment (transit vehicles) available for use
5. Enough trained supervisors to monitor and adjust service as necessary
Improving transit on-time performance
This first of a two-part series explores causes for poor on-time performance and data considerations to adjust vehicle schedules.
by Arthur N. Gaudet
November 19, 2019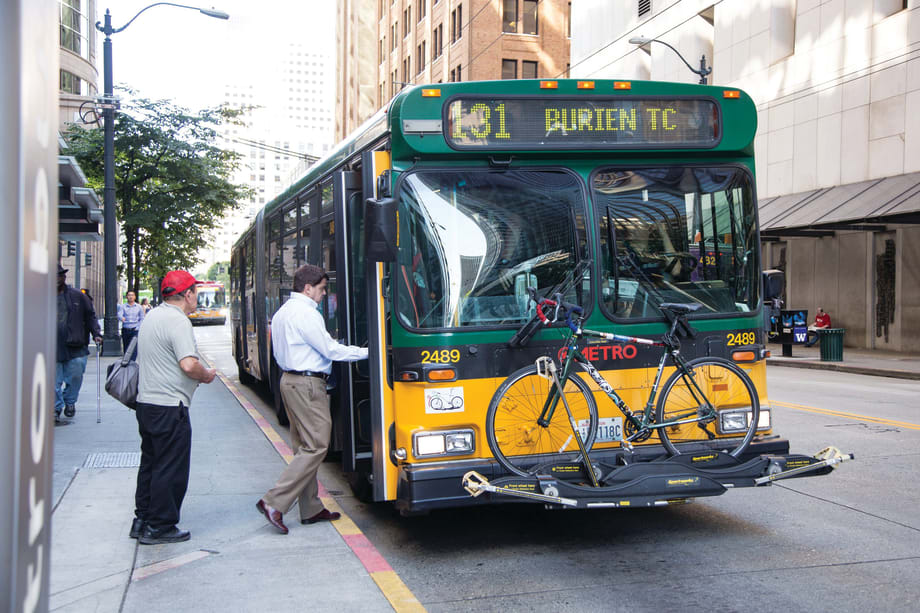
When passengers want to ride, they don’t care what time the bus arrives or where it comes from. They want to be sure the bus does not leave before the appointed time.
King County Metro
6 min to read

On-time performance (OTP), otherwise known as schedule adherence, should not just be a number. Poor OTP should be a call to action. Passengers’ lives are affected when we don’t keep promises and fail to adhere to the printed timetable. They don’t get to work on time, so their jobs (or wages) are at risk. Students miss class. Missed medical appointments can result in serious health issues for passengers, and increased costs for the health care industry.
While there are formulas to forecast elasticity (ridership increase/decrease) for fare changes (Simpson-Curtin) and for changes in frequency (TCRP Report 95, Chapter 12), there are no known formulas that address quality of service as a determinant of transit usage. Studies have shown many potential factors in declining transit usage in many cities, including telecommuting, re-urbanization, and transportation network companies. Although unprovable, it is reasonable to assume that reliability (OTP) is also a factor in modal choice.
OTP is transit system specific. Some systems do well, reporting OTP in the 90%+ range, while other systems struggle. In one example, a mid-size system was shifting from directly operated to a contracted service. The RFP provided to potential bidders included a stated goal to increase their OTP to 60%. What does that mean? Only four out of 10 buses would leave timepoints “on-time.”
Defining OTP in the Real World
Two definitions are frequently seen:
Leaving a timepoint zero minutes early, up to five minutes late.
Or, leaving a timepoint no more than one minute early or five minutes late.
“Leaving” considers OTP from the passengers’ perspective. When passengers want to ride, they don’t care what time the bus arrives or where it comes from. They want to be sure the bus does not leave before the appointed time. When the bus does leave early, they didn’t miss the bus — the bus missed them. Before automation, street supervisors managed OTP in the field, ensuring vehicles didn’t leave early. Now, electronics do the task, but must be programmed. So, here’s the first opportunity to look at your OTP numbers — are you collecting the right data?
Causes of Poor OTP
Analyzing National Transit Database (NTD) data from 1995 until 2017 (the most recent available), we see an 8.4% decrease in Revenue Miles Per Hour, from 13.09 in 1995 to 11.99 in 2017. Concurrently, review of Federal Highway Administration reports shows an increase in congestion. Increased congestion, reduced speed — two sides of the same coin.
Beyond congestion, stop dwell times have increased with increasing use of mobility devices — reflecting the aging population. Factors such as bicycle mounting/dismounting and fare payment delays in some cities affect net bus speeds. If we have not adjusted our routes and schedules in response, we are highly likely to see decreased OTP. Have you considered traffic changes in your city? How have you responded to them?
There are many causes of poor OTP. One example illustrates the difference between statistical reporting and the meaning of the numbers. Many systems operate commuter service, from the “country” to the city in the morning, reversing in the afternoon. Of course, timetables show the morning inbound departure times in the suburb, that’s where we are picking up passengers. Obviously important. They also show downtown arrival times, so riders know what bus should get them to work on time. If, however, actual downtown arrival times are measured for OTP, we are statistically penalizing ourselves for doing a good job — arriving early. Here’s another question then: Are you collecting meaningful data?
Too many timepoints
Another element comes from establishing too many timepoints. Some systems show timepoints as close as one, two, or three minutes apart. During my assessments, I have followed buses that passed these timepoints a minute or two early but were exactly on time further along the route. The operator knew he/she needed the time later, that the allowed running times were incorrect. (In this situation, running times were too generous early in the route). However, each time that occurred, there was a self-inflicted wound, an “early.” In another case, a system assigned a time to each bus stop. With closely spaced stops, the timetable showed buses at two or three places simultaneously, a physical impossibility.
A much better practice is to establish timepoints roughly 10 minutes apart, perhaps a little closer or farther if a major demand generator is involved. Over a 10-minute span, the operator can vary driving style to hit timepoints on time. Passengers can interpolate times at their locations over such a short distance.
Some may consider it cheating to improve the OTP metric by reducing the number of observations. A broken watch is correct twice a day. The contrary thought is that too many timepoints is a disservice to passengers if running times are inaccurate. A by-product is that OTP metrics fall short because we under-value passenger intelligence. Are you using best practices in scheduling?

Clockface headways
Another self-inflicted wound may come from an insistence on using clockface (or clock) headways. A clock headway may see a bus every 60, 30, 20, 15, 12, 10, etc., minutes — the same time past each hour. Also known as a “memory schedule,” the concept is that it’s easy for passengers to remember — thus user-friendly. That only works, though, if the round-trip running time (cycle time) is sustainable.
If an established one-bus route operated reliably on a one-hour cycle time, in 1995 it could operate about 6.5 miles in each direction — outbound for about 26 minutes, inbound for 26 minutes (we’ll discuss recovery time later). Using the NTD data, in 2017 that distance reduces to six miles in each direction, while the cycle time must remain the same. However, we have an added factor in many cities, adding to (not subtracting from) the route. We must extend to the new industrial park, mall, hospital, school. Often, the rubber band has been stretched to meet the two goals — maintain/extend service while retaining the clockface headway. Where does the stretch come from? Most likely, decreased on-time performance.
In evaluating a transit system that operated clock headways, some routes every 60 minutes and every 30 minutes, on paper, route design, congestion, and fare card reloading delays rendered the cycle times unsustainable. Passengers at the system’s hub missed connections. The evaluation of running times showed that a shift to a 70/35-minute headway would be sustainable as a stopgap measure, pending a full-service evaluation. Passenger connections would improve. However, there was a concern about the optics — since this would appear as a service reduction. Are you attempting to put five pounds of sugar in a four-pound bag?
All systems are constrained by funding. Managers and boards must compromise. Coverage with limited resources constrains frequency. Policy frequencies, as seen in a clock headway situation, may constrain the distance that can be covered. Lack of compromise in these two factors results in the third leg of the service triangle falling short — on-time performance. So, a last question, where do you stand on the frequency/coverage/service quality triangle?
In some cities, there is an additional disconnect between finances and achievable schedules. The systems with the “up escalator” and “down escalator” department silos focus on broad numbers, not the effect on individual passengers. Systems which contract service, purchasing operations “by the hour” may penalize the contractor for performance using liquidated damages. There can be a potential conflict of interest if this reduces system expense, but it may divert the reason for low OTP.
To conclude, let’s tie the questions together. Are you setting up for success by reporting meaningful OTP, or are you giving transit opposition an opening to criticize the system’s performance? Are you able to do what you promise the riding public by making those tough compromises or letting quality suffer? If service quality doesn’t reach an acceptable level, are you adequately serving the riding population, or forcing them to other modes?
Arthur N. Gaudet is president of Arthur N. Gaudet & Assoc. Inc. (runcutter@runcutter.com). This article is based on his book, Improving On-Time Performance in the Transit Industry: A Practical Guidebook.
Subscribe to Our Newsletter
More Management

FIFA World Cup Matches Are Driving Record Transit Ridership Nationwide
See how World Cup matches are generating record transit demand across North America, with ridership surpassing Super Bowls, concerts, and Olympic-era events.
Read More →
The Hidden Cost of Fuel Data Inaccuracy in Public Transit Fleets
In today's transit environment, accurate fuel and mileage data are critical to reducing costs, minimizing downtime, and improving fleet performance.
Read More →
Virginia's $28.5B Transportation Plan Targets Transit and Rail
Approved by the Commonwealth Transportation Board, the program supports ongoing infrastructure projects while providing new investments in transit, state of good repair and transportation alternatives.
Read More →
Latinos In Transit Seeks Host Organization for 2027 Leadership Summit
The selected host organization will showcase its transit system, projects, and community while welcoming hundreds of industry leaders and emerging professionals during Hispanic Heritage Month.
Read More →
Bipartisan BUSES Act Seeks Changes to New York City's Bus Idling Enforcement Program
Backed by motorcoach operators, the legislation seeks to balance emissions goals with passenger safety by allowing limited idling for inspections, accessibility needs and extreme weather conditions.
Read More →
DOT: Brightline Corridor Incidents Fall 30% Following Federal Safety Upgrades
Safety improvements funded through a $25 million federal investment are credited with reducing trespassing and train-vehicle collisions along the Brightline Florida corridor.
Read More →
D Line Expansion Fuels Growth Across LA Metro's Rail System
Weekend rail ridership was especially strong, soaring 18% as riders embraced expanded access to jobs, entertainment, dining, and cultural destinations, said the agency. Total system ridership for May, including bus and rail, was 26,966,657.
Read More →
Q4 Travel Data Reveals Drop in Vehicle Traffic to Manhattan Congestion Zone
NYMTC’s quarterly Travel Patterns Report provides a snapshot of travel activity throughout New York City, Long Island, the Lower Hudson Valley, and northern New Jersey using data collected from the agencies operating the region’s bridges, tunnels, and public transit systems.
Read More →
Southern California's Metrolink Debuts Contactless Fare Payment Pilot
Customers traveling between Redlands and Los Angeles can now tap their preferred payment method, including a credit or debit card, mobile wallet, or wearable device, at station validators before boarding and again while exiting.
Read More →
California's BART Approves FY27 Budget While Maintaining Service Levels
The budget covers July 1, 2026, through June 30, 2027, a period when pandemic emergency funds run out, the District faces a structural deficit of $375 million, and a regional transit funding measure may appear on the November ballot.
Read More →