
2014 Paratransit Survey: Ridership Sees Steady Increase, Travel Training on the Rise
Sixty-six percent of operators cited an increase in rides delivered, with an average of 13% reported. More than one-half tap travel training programs to help alleviate demand on fixed-route, while only 16% use taxis to supplement fleets.

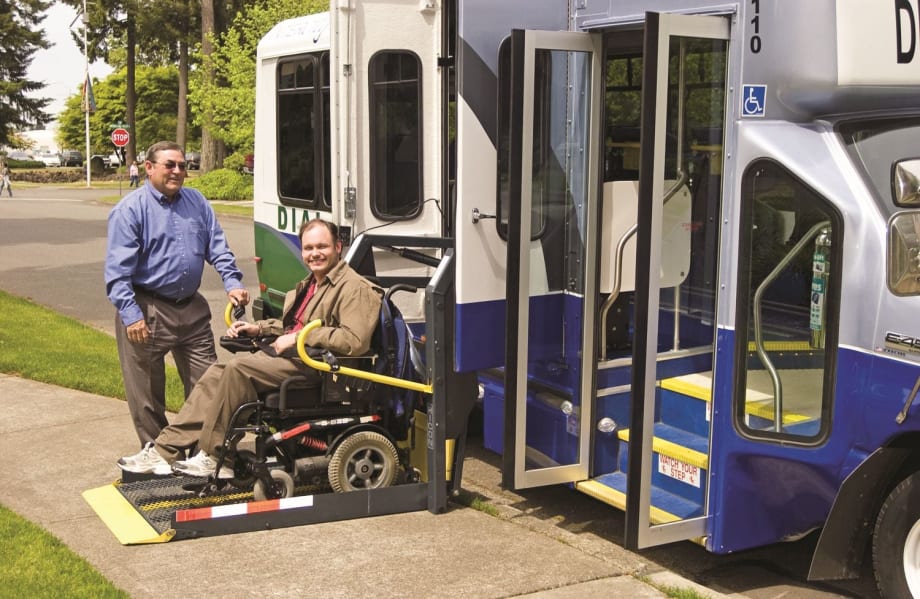
Olympia, Wash.-based Intercity Transit's Dial A Lift paratransit service.

For its 11th annual paratransit survey, which provides a brief overview of the industry’s trends, METRO Magazine received responses from 149 paratransit providers from 37 states in the U.S. and one system in Canada. Respondents answered 32 questions about issues related to providing service, including what their greatest challenges and concerns are, as well as ridership and fleet data.
FLEETS
There are a total of 12,028 vehicles represented in this year’s survey results, with the smallest fleet coming in at one vehicle and the largest comprised of 6,000. The average fleet size is 151 vehicles, and the median is 30. Fifty-four percent of respondents reported having mid- to full-sized vehicles (more than Ridership Sees Steady Increase,Travel Training on the Rise25-feet in length) in their fleets. Vehicles less than 25-feet in length accounted for 15% of the fleet makeup. While buses still had the largest piece of the overall fleet pie at 69%, this appears to be a downward trend continuing from last year.
Vans accounted for 23% of the fleet breakdown, a significant drop from last year’s 43%. Taxis, which accounted for 8%, showed no change. Also staying consistent, are the number of vehicles listed as being wheelchair accessible, with 91% reporting.
Visit metro-magazine.com, to see a photo gallery of fleet vehicles from this year’s participants.
RIDERSHIP
Operators transported a total of 14.8 million riders in 2013. Sixty-six percent of operators cited an increase in their 2013 ridership numbers, averaging 13%, while 33% responded with decreases, which averaged 5.5%. The largest ridership increase reported was 60%.
TAXI SERVICE
Only 16% of survey respondents reported using taxis to supplement their fleets. Of that portion, nearly one-half reported the service was helpful in accommodating riders that didn’t qualify for paratransit, but have special needs. These carriers also shared benefits such as lower operating capital costs and flexibility.
“Taxis can save money during periods of low demand and can help serve ‘peak of the peak’ trips. It is important to get a taxi company that provides good quality service,” said SamTrans’ Tina Dubost. Some challenges related to this service included, “Getting people to trust the service, driver competence and street knowledge is paramount.”
2014 VEHICLE BUYS
The number of surveyed operators planning to purchase new vehicles next year stayed the same as last year, with 33% reporting. The total number of vehicles on order is 789. While nearly one-third of operators do not plan to buy new vehicles, 3% of respondents plan to buy more than 100 vehicles in the upcoming fiscal year, and 7% plan to buy anywhere from 26 to 100 vehicles. The largest number of respondents, however, plan to purchase one to 10 vehicles next year. The top three vehicle manufacturers those surveyed are looking to buy from are ElDorado National, Champion Bus Co. and Glaval.
PRODUCTIVITY AND BILLING
Forty-four percent of survey participants use contrac-tors to deliver rides, with the top two companies being MV Transportation and First Transit. About 65% of respondents reported their contractors billed by the hour, with 35% billing by trip. For those billed by the hour, 75% of those are based on revenue hours (hours when the vehicle is actually in revenue service).
ELIGIBILITY, NO-SHOW POLICIES
Forty-one percent of respondents require in-person interviews for eligibility. The average percentage of denial decisions is less than 5%, while 69% are reporting denials. Denials experienced as a percentage of trips scheduled is, on average, .5%. More than half of respondents had no denials as a percentage of trips scheduled.
Eighty-seven percent of respondents have a no-show policy. Some respondents cited considering a no-show policy “to insure resources are not wasted and efficiency of the service.”
WHEELCHAIR USE
The majority of respondents (58%) reported that less than half of their paratransit riders use wheelchair lifts. One-third reported that half of their riders used lifts, while fewer than 9% say most do.

TRAVEL TRAINING
More than half of respondents (55%) reported having a travel training program in place, and 13% said they are looking into creating one. Some reasons in favor of the program include providing better customer service and alleviating customer’s fears about riding public transportation.
“We have heard of the successes that other sister transit authorities have had with their travel training programs and the potential benefits it can have for riders and the transit system,” according to one surveyed operator.
Thirty-two percent of respondents do not have a training program and are not looking into creating one, primarily due to lack of funds.
“I honestly can’t afford to staff, deliver and evaluate a travel training program. We’re barely hanging on to preservation of existing services,” said one survey respondent.
Respondents reported, on average, that their travel training programs have been in place for 11 years.
In response to whether the program is being supported in part by any other organizations (nonprofits, senior or disabled advocacy groups, colleges or schools) about 31% said they do receive such support. A majority are being supported by nonprofits and disabled advocacy groups at 47% apiece, while 26% receive support from senior
advocacy groups and a little more than 5% are helped out by colleges, universities and schools.
Fifty-four percent of operators say their programs have helped cut costs by moving more riders to its fixed route
system. SueAnn Coffin with Ore.-based Salem-Keizer Transit attributes a $250,000 savings to their operation’s travel training program. Nearly one-third report integrating paratransit with their fixed-route services.
TECHNOLOGY
Nearly 40% of providers reported adding new technology to their operation, which is consistent with the past two years.
Of the technologies being implemented, scheduling and dispatch software took the top spot, with 53%, while AVL systems and IVR/call systems where the next highest, with 30% and 27% respectively. Camera systems, mobile data terminals and CNG vehicles comprised some of the “other” category reported by 43%.
CONCERNS, CHALLENGES
No surprise here, as costs and funding remain the top challenges cited by survey participants, with 23% reporting.
Customers said demand was the second-highest challenge with regard to providing service. Limited resources, customer expectations and service area issues were also listed, with 9% reporting for each.
Some less-cited issues included lift maintenance, issues with maneuvering vehicles or mobility devices safely within a restricted space and lawsuits.
More Management
Turn Transit Data Into Action
Discover how leading agencies are using connected technology to gain real-time visibility across operations, improve service reliability, and reduce disruptions.
Read More →
What Transit-Oriented Development Means for the Future of Public Transportation
Once viewed primarily as transit operators, agencies are now leveraging land, partnerships, and long-term planning to boost ridership, expand housing, and strengthen communities.
Read More →
USDOT Announces $22 Million for Transit Innovation, Updates High-Speed Rail Rules
New federal transit funding will support safety, accessibility, and technology projects as updated rail regulations establish new noise standards for high-speed trains.
Read More →
Transportation Construction Coalition Unveils Infrastructure Case Studies Ahead of Federal Funding Deadline
The coalition noted the next surface transportation bill should provide sustained investment in highways and public transit to strengthen freight movement, improve safety, and support economic growth.
Read More →
People Movement: American Bus Association Extends Ferguson and More
METRO’s People Movement highlights the latest leadership changes, promotions, and personnel news across the public transit, motorcoach, and people mobility sectors.
Read More →
METRO Magazine Announces 2026 Innovative Solutions Awards Winners
Projects Recognized for Advancing Mobility Through Technology, Accessibility, Workforce Innovation, and Operational Excellence
Read More →
MBTA Rolls Out Pilot Programs to Cut Costs, Simplify Travel
Three new fare pilots — including unlimited two-hour transfers, reduced express bus fares, and free transit for eligible seniors — will launch this fall as Massachusetts extends popular commuter rail discounts through November.
Read More →
FTA Opens $610 Million Funding Opportunity for Bus Infrastructure Projects
The latest Notice of Funding Opportunity provides transit agencies with funding for bus facilities, fleet modernization, and low- and no-emission vehicles, with applications due September 21.
Read More →Biz Briefs: STV teams with Amtrak, Motorcoach Operators Boost Fleet and Land Contracts, and More
From manufacturers and suppliers to transit agencies and motorcoach operators, these updates offer a snapshot of the projects, partnerships and business moves driving the industry forward.
Read More →
Massachusetts Approves $530M to Strengthen MBTA Operations, Infrastructure
The funding package targets operating stability, capital improvements, and fare affordability, offering a model for agencies navigating long-term funding challenges.
Read More →