

RELATED: NJT expands de-escalation training for frontline staff
NJ TRANSIT launches online performance dashboard
Contains industry-standard metrics for on-time performance, mechanical reliability and the causes for delays and cancellations.
November 26, 2019
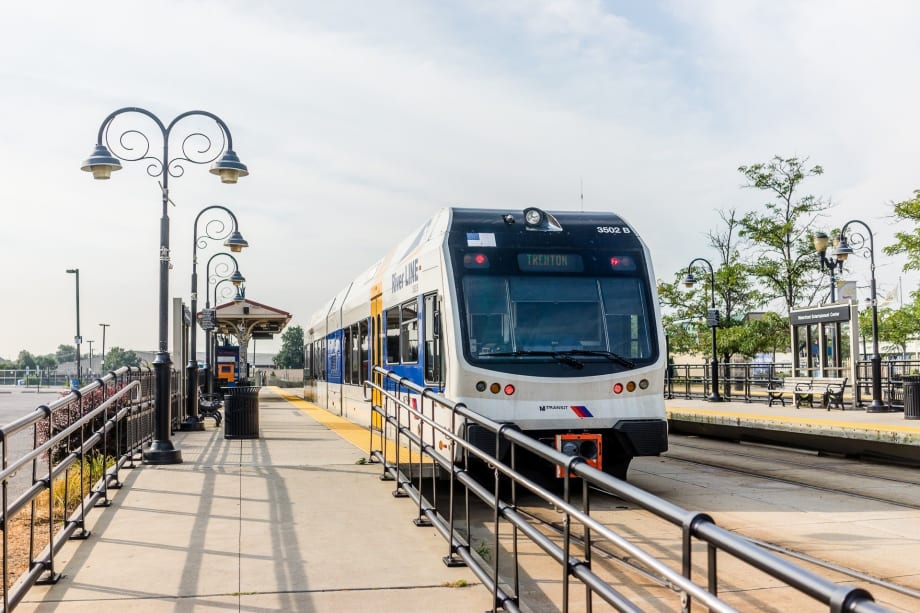
NJ TRANSIT's new performance dashboard will show current data for bus, light rail and Access Link, and will be updated each month with data for the previous month’s service.
NJ TRANSIT
2 min to read
As part of NJ TRANSIT’s commitment to improving service and transparency, and in support of Governor Phil Murphy’s Executive Order No. 80, NJ TRANSIT has launched a new performance dashboard. It contains industry-standard metrics for on-time performance, mechanical reliability and the causes for delays and cancellations.
The Progress by the Numbers dashboard displays data from January 2017 through October 2019 for rail operations, as well as current data for bus, light rail and Access Link, and will be updated each month with data for the previous month’s service.
The dashboard also highlights the progress by the transit agency since January 2018 to fulfill mandatory safety requirements, modernize the fleet, communicate real-time service status conveniently, and recruit new bus operators, locomotive engineers, and assistant conductors.
About Executive Order 80
On August 19, 2019, Governor Murphy issued Executive Order No. 80 requiring NJ TRANSIT to post rail performance metrics dating back to January of 2017.
Beginning this month, the data includes:
Total number of rail cancellations, including reasons such as manpower shortages, equipment or infrastructure issues, unpreventable external events such as weather or trespassers, and cancellations due to earlier delays;
Rail on-time performance and mean distance between failure of the NJ TRANSIT rail systems;
Bus, light rail and Access Link on-time performance;
Bus and light rail mean distance between failure data; and
Additional information determined important to NJ TRANSIT customers to gauge the company’s performance.
About Performance Statistics
On-Time Performance measures the percentage of service adhering to schedules. To account for minor variations in service, vehicles operating within six minutes of published schedule are considered on time.
Mean Distance Between Failure (MDBF) measures the average distance traveled by vehicles before maintenance or repairs are required. MDBF is higher for new equipment, and lower for older equipment that requires more frequent maintenance.
Cancellations in relation to overall service reflect various factors, including crew and equipment availability, infrastructure issues, weather impacts, as well as trespasser and other incidents.
More Management

What Transit-Oriented Development Means for the Future of Public Transportation
Once viewed primarily as transit operators, agencies are now leveraging land, partnerships, and long-term planning to boost ridership, expand housing, and strengthen communities.
Read More →
USDOT Announces $22 Million for Transit Innovation, Updates High-Speed Rail Rules
New federal transit funding will support safety, accessibility, and technology projects as updated rail regulations establish new noise standards for high-speed trains.
Read More →
Transportation Construction Coalition Unveils Infrastructure Case Studies Ahead of Federal Funding Deadline
The coalition noted the next surface transportation bill should provide sustained investment in highways and public transit to strengthen freight movement, improve safety, and support economic growth.
Read More →
People Movement: American Bus Association Extends Ferguson and More
METRO’s People Movement highlights the latest leadership changes, promotions, and personnel news across the public transit, motorcoach, and people mobility sectors.
Read More →
METRO Magazine Announces 2026 Innovative Solutions Awards Winners
Projects Recognized for Advancing Mobility Through Technology, Accessibility, Workforce Innovation, and Operational Excellence
Read More →
MBTA Rolls Out Pilot Programs to Cut Costs, Simplify Travel
Three new fare pilots — including unlimited two-hour transfers, reduced express bus fares, and free transit for eligible seniors — will launch this fall as Massachusetts extends popular commuter rail discounts through November.
Read More →
FTA Opens $610 Million Funding Opportunity for Bus Infrastructure Projects
The latest Notice of Funding Opportunity provides transit agencies with funding for bus facilities, fleet modernization, and low- and no-emission vehicles, with applications due September 21.
Read More →Biz Briefs: STV teams with Amtrak, Motorcoach Operators Boost Fleet and Land Contracts, and More
From manufacturers and suppliers to transit agencies and motorcoach operators, these updates offer a snapshot of the projects, partnerships and business moves driving the industry forward.
Read More →
Massachusetts Approves $530M to Strengthen MBTA Operations, Infrastructure
The funding package targets operating stability, capital improvements, and fare affordability, offering a model for agencies navigating long-term funding challenges.
Read More →
LA Metro Marks Banner Year, Sets Ambitious Goals for New Fiscal Year
Incoming LA Metro Board Chair and Los Angeles Mayor Karen Bass joined outgoing Board Chair Fernando Dutra and LA Metro CEO Stephanie Wiggins to review accomplishments from fiscal year 2026, which included the opening of new rail extensions, advancement of major transit projects, expanded safety programs, and new rider amenities.
Read More →