
TransLink Report Details Pandemic Ridership Trends
According to the agency's 2020 Transit Service Performance Review, annual system-wide boardings were down 52% when compared to 2019.
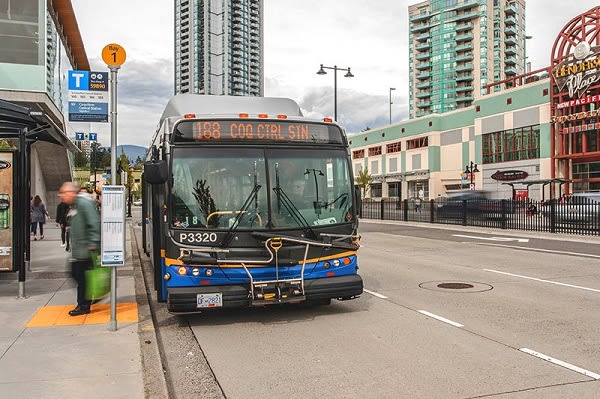
Despite drops in ridership, most of TransLink’s bus ridership (85%) continued to be carried on routes that provide frequent service throughout the day and during peak periods.
TransLink
Canada’s TransLink unveiled its 2020 Transit Service Performance Review (TSPR), detailing the agency’s ridership trends amid the COVID-19 pandemic.
The report focuses on a stable eight-week ridership period between September and November 2020, as more people continued to take public transit despite challenges posed by the pandemic and public health restrictions.
To determine how ridership trends at the regional, sub-regional, modal, and route level measured up to pre-pandemic trends, the report compares early fall 2020 ridership data to that from the same period in 2019. For example, TransLink’s ridership between September to November 2020 was reportedly 41% of ridership volumes during the same period in 2019. Meanwhile, for a year-over-year comparison, the report shows TransLink’s annual system-wide boardings were down 52% in 2020 when compared to 2019.
Despite a major drop in ridership, Gigi Chen-Kuo, Translink’s interim CEO, said emergency relief funding from the federal and provincial governments are ultimately what helped the agency maintain “near-normal service levels, ensuring people had transportation for work and access to essential services.”
“Our ability to provide fast, reliable, and safe service throughout the pandemic has been crucial to B.C.’s recovery, particularly as the economy gradually reopens and more customers return to using transit regularly,” she added.
Here is a closer look at TransLink’s 2020 ridership trends:
Most of TransLink’s bus ridership (85%) continued to be carried on routes that provide frequent service throughout the day and during peak periods. Eight of the top 10 busiest bus routes in 2019 were still among the top 10 routes by boardings.
Ridership on bus routes that serve essential workers remained strong in 2020, including routes that primarily serve industrial areas, such as routes 116, 175, 418, and 640.
Commuter services to Downtown Vancouver and routes that exclusively serve university/college campuses saw significantly lower ridership recovery. The West Coast Express recovered to 17% of 2019 ridership. Bus routes that exclusively serve campus-bound customers recovered to 20% of 2019 volumes.
The Southeast sub-region (Surrey, Langley, North Delta, and White Rock) saw the highest return of bus ridership, with volumes at 55% of 2019 levels — higher than the bus network average of 44%.
HandyDART continued to provide critical access to medical services and other important destinations. While overall HandyDART ridership was down, HandyDART customers made 100% of dialysis appointment trips, 78% of cancer appointment trips, and 57% of general medical appointment trips, when compared to 2019 numbers.
More Bus
Biz Briefs: STV teams with Amtrak, Motorcoach Operators Boost Fleet and Land Contracts, and More
From manufacturers and suppliers to transit agencies and motorcoach operators, these updates offer a snapshot of the projects, partnerships and business moves driving the industry forward.
Read More →
LA Metro Marks Banner Year, Sets Ambitious Goals for New Fiscal Year
Incoming LA Metro Board Chair and Los Angeles Mayor Karen Bass joined outgoing Board Chair Fernando Dutra and LA Metro CEO Stephanie Wiggins to review accomplishments from fiscal year 2026, which included the opening of new rail extensions, advancement of major transit projects, expanded safety programs, and new rider amenities.
Read More →
DART Taps Nathaniel P. Ford Sr. as Next President/CEO
Since 2012, Ford has served as the CEO of the Jacksonville Transportation Authority
Read More →
AC Transit’s Cecil Blandon on Building the Next Generation of Transit Maintenance Leaders
The agency’s maintenance chief discusses leadership, workforce development, zero-emission technology, and preparing technicians for the future of public transportation.
Read More →
Building the Next Generation of Transit Technology
In this edition of METROspectives, Luminator CEO Magnus Friberg discusses the company's transformation, the growing role of AI and software, and what's next for transit technology.
Read More →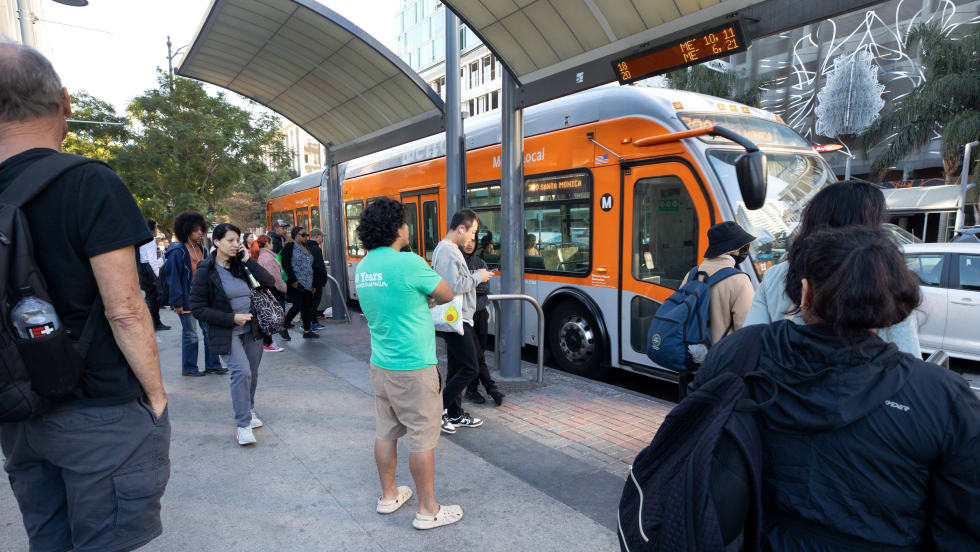
June LA Metro Ridership Surges 2 Million Year Over Year
Total June ridership increased for both weekdays and weekends. Weekday ridership was 953,820, which grew 8.4% from June 2025; Saturdays increased nearly 13% year-over-year to 708,826; and Sundays increased 7.7% to 611,534 from June 2025, according to LA Metro.
Read More →
Washington's Pierce Transit Board Sends Transit Funding Measure to November Ballot
With the adoption of Resolution 2026-006, the measure moves to the Pierce County Auditor, giving voters in the Pierce Transit service area the decision on whether to fund an expansion of local transit service within the agency’s service area.
Read More →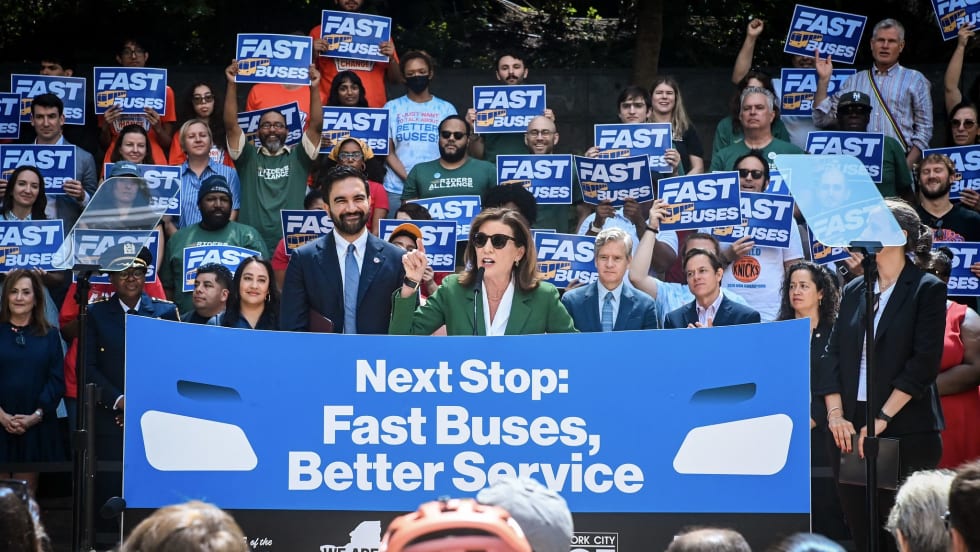
New York Unveils Sweeping Plan to Modernize City Bus Service
Next Stop: Fast Buses, Better Service identifies 50 priority bus corridors for improvements across the five boroughs and launches the City’s next generation of rapid bus service along five key routes.
Read More →
CTDOT Taps STV for Electric Bus Facility Design
The firm will work with CTDOT and RVT to define the facility layout, operational requirements, and long-term flexibility for RVT’s growing electric fleet.
Read More →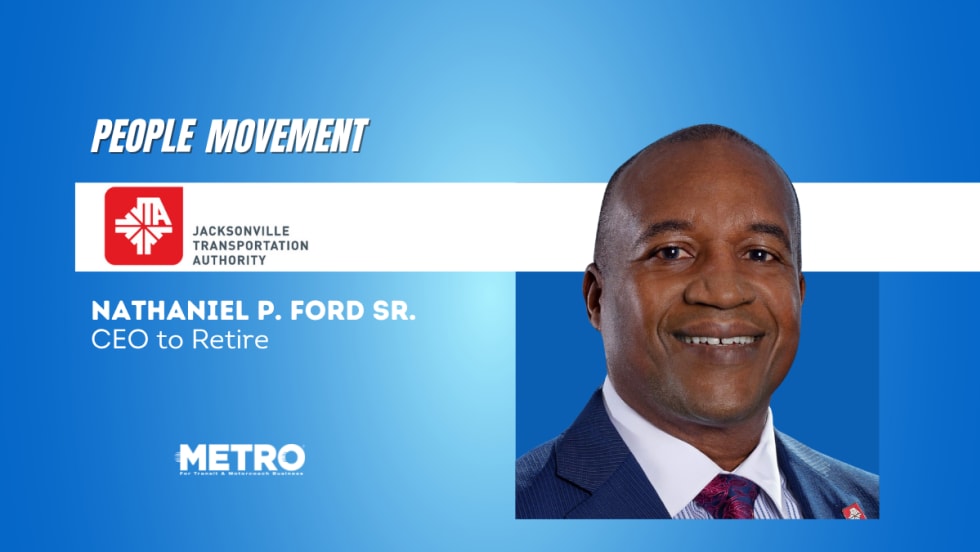
Ford to Leave JTA After More Than 10 Years as CEO
He plans to continue his work advancing innovative mobility solutions to improve the quality of life in communities across the nation. He did not announce specific plans.
Read More →