
The Key to Increasing Customer Satisfaction? Just Listen
We have long believed the industry should have an answer as to which community has focused on delivering the highest level of customer experience.

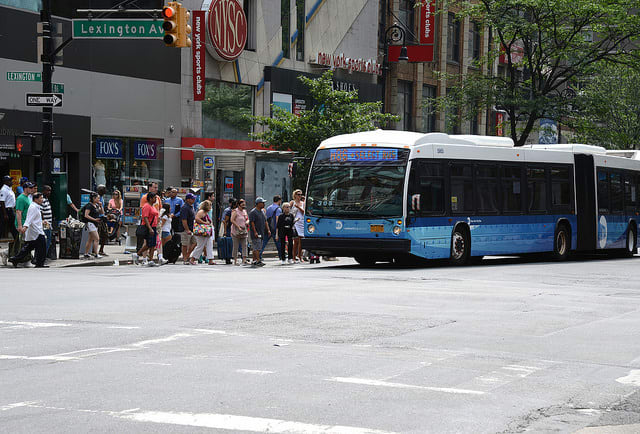
New York City Transit, the nation’s largest transit agency by a function of two-times, have increased customer satisfaction by more than 20%.
Photo: Marc A. Hermann
We have the pleasure of working with public transportation agencies across the country in both measuring and managing customer satisfaction. We have long believed the industry should have an answer as to which community has focused on delivering the highest level of customer experience.
To that point, whether you run a coffee shop, the zoo, or a transit agency there are three core elements of delivering a quality customer experience:
Empower the customer to pick and prioritize what elements of the experience are most important to them.
Have meetings that matter on precisely the topics that “move the needle.” That is service deliverables customers rank as important but are unsatisfied with current levels of performance.
Share a keen understanding of whether meeting customer expectations is a function of true operational performance vs customer impression.
Improving Customer Satisfaction
New York City Transit President Rich Davey and his leadership team have done something extraordinary over the past 18 months. In the nation’s largest transit agency by a function of two-times, they have increased customer satisfaction by more than 20%. Even more extraordinary is you likely didn’t know that.
By Davey and his team empowering the customer, they came to learn safety, vehicle and station cleanliness, and trip time are the most important elements of customer experience. These topics consume them.
At New York City Transit, you won’t find endless meetings surrounding on-time performance, mean distance between failures, nor the percent of vehicles that are electric. Their customers have clearly told them the topics won’t move the needle on their satisfaction level. They measure what matters and are focused on delivering that. Happier customers rules the conversation — and happier customer they have.
Keys to Empowering Customers
Of course, one of the core elements of truly empowering customers is the recognition that what customers prioritize in Sacramento is different than in Syracuse. Cleveland customers think about their experience differently than Columbus. What satisfies a New York City Transit customer is undoubtedly different than yours. However, one common trend we have seen over the past year in our national market research for transit agencies is that “fare price” is skyrocketing as a topic of importance.
We wondered why.
It turns out the average household income of a fixed-route transit customer has plummeted by 14% from pre-COVID to post-COVID.
Newly released data from the 2022 American Community Survey indicates that the median income of US workers who commute by public transportation is still substantially below the pre-COVID median.
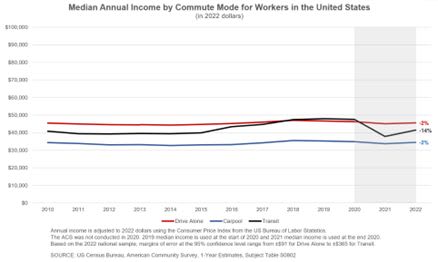
Newly released data from the 2022 American Community Survey indicates that the median income of US workers who commute by public transportation is still substantially below the pre-COVID median.
Photo: U.S. Census Bureau
From 2019 to 2021, median annual income for US workers who used transit to commute decreased by 21% from $48,000 to $38,000. New data shows the median income increased slightly in 2022 but is still 14% lower than the pre-COVID level. Median annual income for transit commuters remained substantially lower in metro areas like San Francisco/Oakland, Calif. (-17%); Seattle-/Tacoma, Wash. (-32%); and Washington/Arlington/DC-VA-MD (-24%).
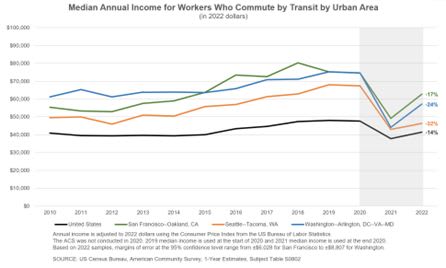
Median annual income for transit commuters remained substantially lower in metro areas like San Francisco/Oakland, Calif. (-17%); Seattle-/Tacoma, Wash. (-32%); and Washington/Arlington/DC-VA-MD (-24%).
Photo: U.S. Census Bureau
Transit and “Fare Prices”
Many transit agencies have seen off-peak ridership increase at a faster rate than peak ridership. Lower-income workers are both less likely to work from home and more likely to work during non-traditional hours. If, as the data shows, transit customers are increasingly lower income than before COVID, we must consider the unique needs of this growing percentage of the customer base.
And directly correlated, we are seeing several of our transit agencies have “fare prices” move from a middle-of-the-pack input to the number two most important factor in driving customer satisfaction levels. What this means to transit agencies expressing concerns about their financial sustainability is a potential increase in fares as a modest form of revenue will directly impact their customer satisfaction levels in a manner the industry has likely never seen.
As we continue to innovate in modernizing the measurable value the public transportation industry brings to their communities and the country, transit agencies committed to an improved level of customer satisfaction will need to reconsider the traditional transit answer of raising fares to raise revenues.
More Blog Posts
Velo-city Conference 2026: Latest Trends in Cycling as Part of Urban Mobility
The global cycling conference highlighted how cities are integrating bicycles into multimodal transportation networks, expanding cycle tourism and reshaping urban mobility.
Read More →
Kindness Isn’t Soft...It’s Strategic.
Mike Bismeyer — often known as “The Kindness Guy” — has spent more than 17 years in public transit and mobility, serving in industry leadership roles, speaking across North America, and advocating for stronger workplace cultures. But his message doesn’t come from theory. It comes from lived experience.
Read More →
Inside ITF 2026: Transport Reacts to A Challenging World
Transport leaders from around the world gathered in Leipzig, Germany, for the 2026 International Transport Forum to discuss resilience, climate impacts, supply chains and the future of sustainable mobility.
Read More →
Every Ride Tells a Story — But You’re Not Just Selling the Ride
You’re selling the moment, the meaning, and the emotion behind it.
Read More →
How Digital Signage is Reshaping the Traveler Experience at Transportation Hubs
What was once a landscape of static signs has evolved into a responsive, immersive environment powered by real-time visual communication.
Read More →
Latest Trends in Urban Mobility from Polis Conference 2025
Polis comprises cities and regions, as well as corporate partners, from across Europe, promoting the development and implementation of sustainable mobility. This year’s event had over a thousand attendees across various policy forums and an exhibition.
Read More →
Why Transit Leaders Require Better Tools for Operational Clarity In Today’s Tech-Fragmented Environment
Across North America and beyond, transit agency officials are contending with a perfect storm of operational headaches and strategic challenges that hamper daily service and long-term progress.
Read More →
The Powerless Brokers: Why California Can’t Build Transit
It is no secret that transit in the U.S. is slow and expensive to build.
Read More →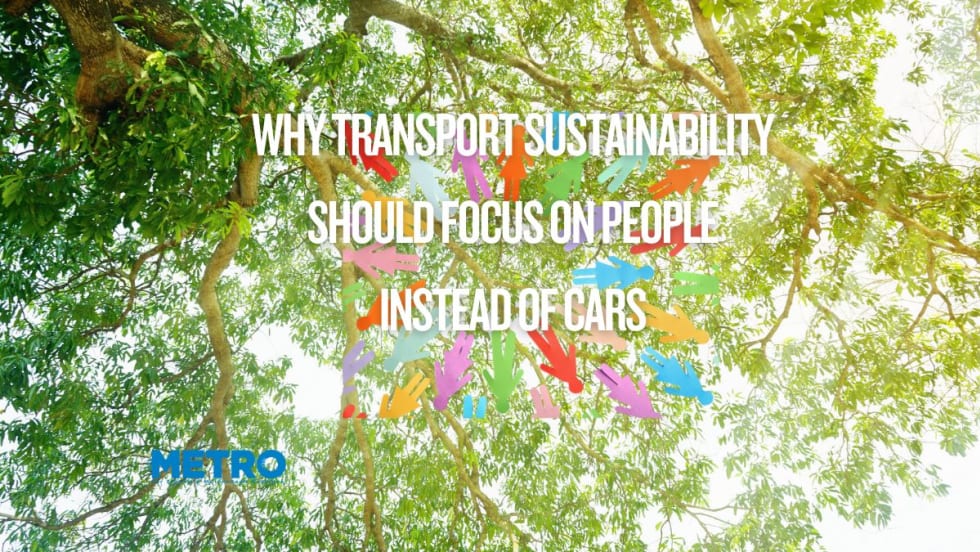
Why Transport Sustainability Should Focus on People Instead of Cars
Simply incentivizing electrification is not enough to make a meaningful impact; we must shift our focus toward prioritizing public transportation and infrastructure.
Read More →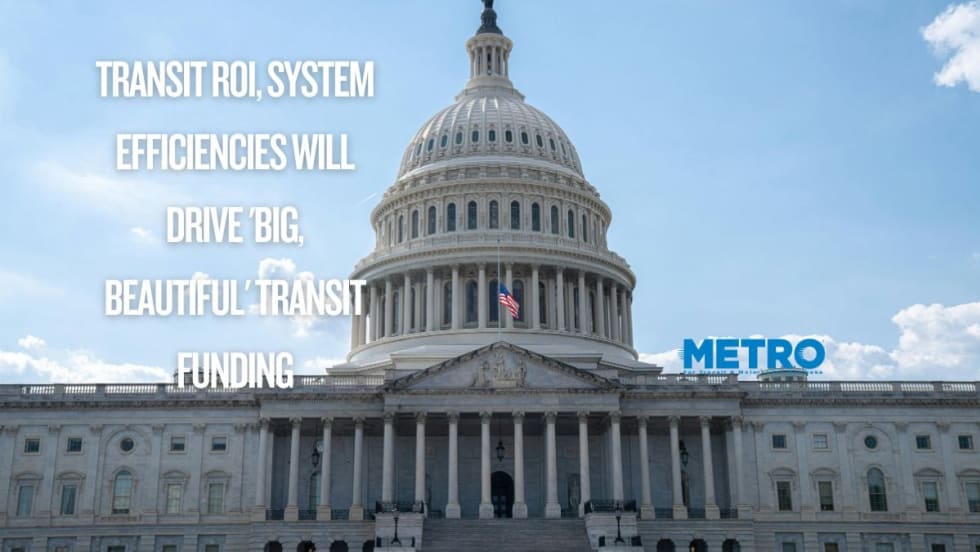
Transit ROI & System Efficiencies Will Drive 'Big, Beautiful' Transit Funding
For many years, the narrative surrounding public transit improvements has been heavily weighted toward environmental gains and carbon reduction. While these are undeniably crucial long-term benefits, the immediate focus of this new funding environment is firmly on demonstrable system efficiencies and a clear return on investment.
Read More →