Micromobility Usage in North America at 'All-Time High'
Being the fifth annual edition of the NABSA report, the 2023 State of the Industry Report demonstrates shared micromobility’s continued viability and strength as an important mode in the public transportation ecosystem
Both an English and Spanish version of the NABSA report is available for download.
Photo: NABSA
3 min to read
The North American Bikeshare and Scootershare Association (NABSA), the nonprofit membership-based association representing public, private, and nonprofit organizations in shared micromobility, released the fifth annual Shared Micromobility State of the Industry Report for North America.
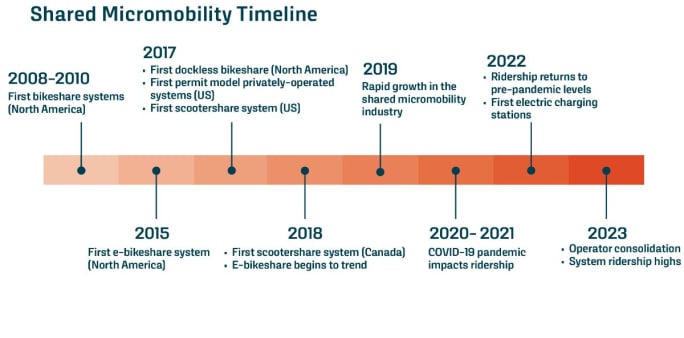
Being the fifth annual edition of the report — tracking trends before, during, and after the COVID-19 pandemic — the 2023 State of the Industry Report demonstrates shared micromobility’s continued viability and strength as an important mode in the public transportation ecosystem, and shows an industry that continues to grow, mature, electrify, and gain efficiencies and effectiveness.
Ad Loading...
Shared Mobility in North America
Shared micromobility ridership across North America, as well as the number of cities with systems, reached its highest annual level to date.
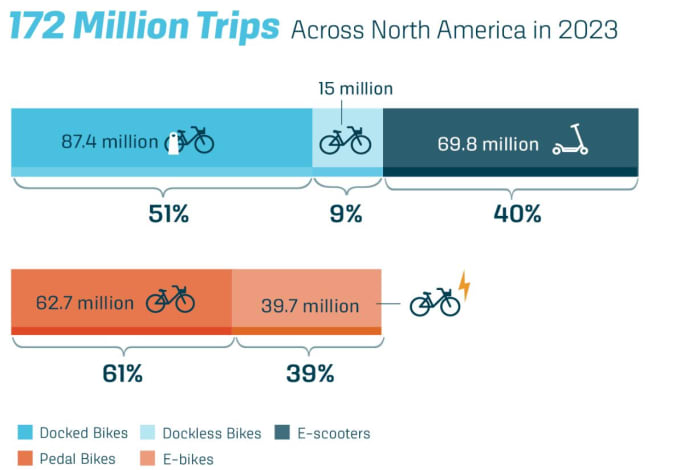
In 2023, at least 172 million shared micromobility trips were taken in 421 cities across North America.
“There’s just no two ways about it, shared micromobility consistently delivers, year-over-year-over-year,” said NABSA Executive Director Sam Herr. “Communities increasingly view and utilize shared micromobility as an essential mode in a multimodal network. This is what we need to further climate and equity goals and make our communities more sustainable into the future.”
Total shared micromobility vehicles deployed across North America decreased slightly in 2023 while the number of trips continued to rise, meaning that fleets generally had more rides per vehicle per service day.
The higher utilization points to more fleet effectiveness and efficiency.
Ad Loading...
Shared micromobility ridership across North America, as well as the number of cities with systems, reached its highest annual level to date.
Photo: NABSA
Adding Sustainability to Micromobility Operations
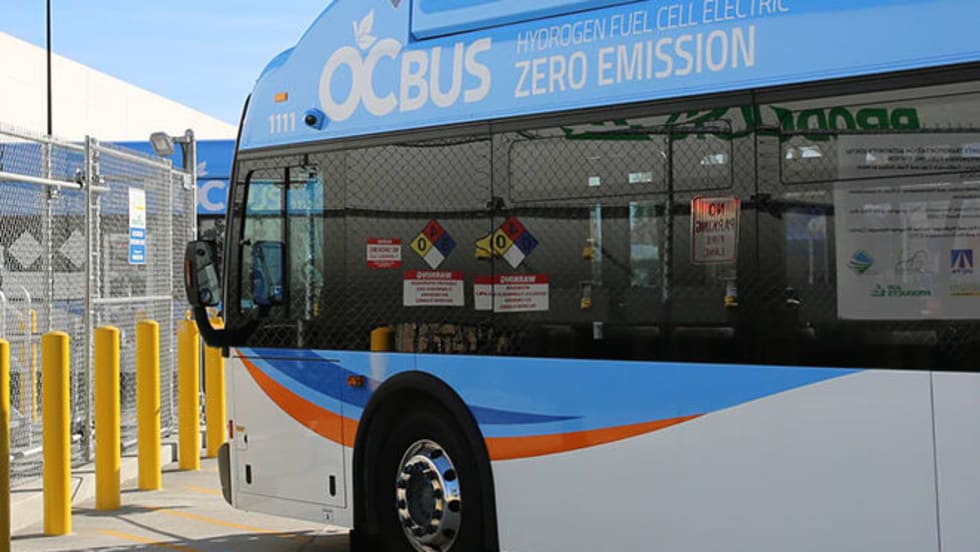
New this year, the report captures how operators are electrifying and incorporating climate-friendly practices into shared micromobility operations.
Sixty-seven percent of operators use e-bikes and 46% use EVs or hybrid vehicles to rebalance their shared micromobility fleets.
In 2023, shared micromobility across North America offset approximately 81 million pounds of CO₂ emissions (37 million kg) by replacing car trips — 303 million lbs. of CO₂ emissions since 2019 — and 37% of all shared micromobility trips continue to replace car trips.
Sixty-four percent of shared micromobility rides in 2023 were taken on an e-device, and 82% of systems across North America incorporate electric shared micromobility devices.
Ad Loading...
E-bikeshare trips continue to increase over time, from seven million in 2019 to almost 40 million in 2023.
Shared micromobility continues to support transit with first/last mile service and make transportation more equitable.
Seventy percent of riders report that they used shared micromobility to connect to transit, and 20% say they use it weekly to connect to transit.
Ninety percent of shared micromobility systems offer discount programs, and 31% offer adaptive vehicles.
In these ways, shared micromobility continues to be an integral part of transportation networks, increasing mode choice, transportation equity and sustainability, and helping to ensure that people get to where they need to go, according to NABSA.
Ad Loading...
The popularity and use of electric shared micromobility continues to trend remarkably upward.
Photo: NABSA
Micromobility Setting Firm Roots
Over the last 15 years as shared micromobility has turned the corner from proof-of-concept to integral transportation service, the cross-sector industry of shared micromobility is turning an eye toward financial sustainability.
In recent years, public agencies across North America are starting and increasing their direct financial investment in shared micromobility services. New this year, the report captures a snapshot of this emerging support, as well as other financial expenses and operating characteristics.
“We’re at an all-hands-on-deck moment in shared micromobility. Support at state, provincial, and federal levels are needed to join in this effort,” says Herr.
Report Background
NABSA worked with Toole Design and the University of California Berkeley Transportation Sustainability Research Center to help develop the report.
The report is composed of survey results, statistics gathered from performance reports released by shared micromobility systems, and data from GBFS.
Ad Loading...
In addition to the metrics shared above, more information about year-over-year trends, mode shift, benefits of shared micromobility, equity programs, trip and vehicle trends, system statistics by size, operating characteristics, shared micromobility and transit, and more can be found in the report.
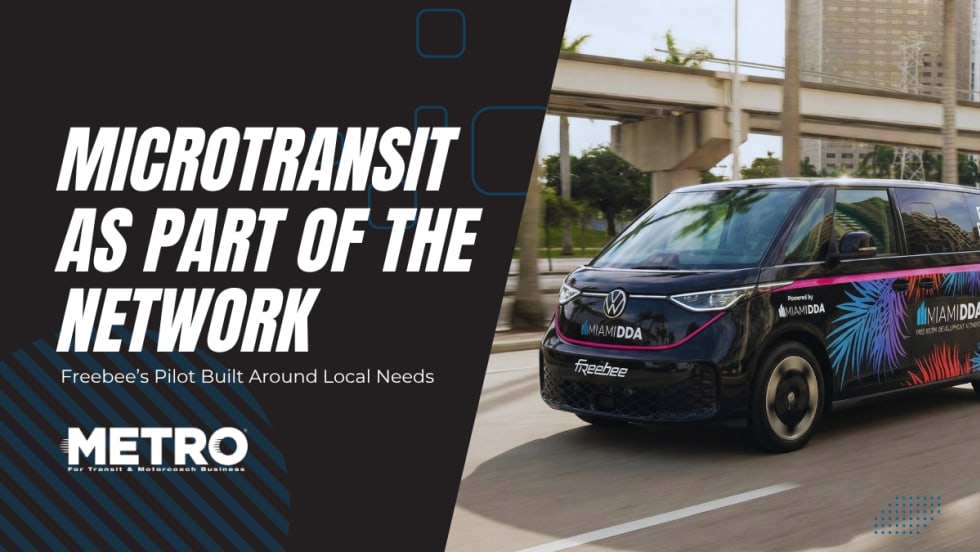
From manufacturers and suppliers to transit agencies and motorcoach operators, these updates offer a snapshot of the projects, partnerships and business moves driving the industry forward.
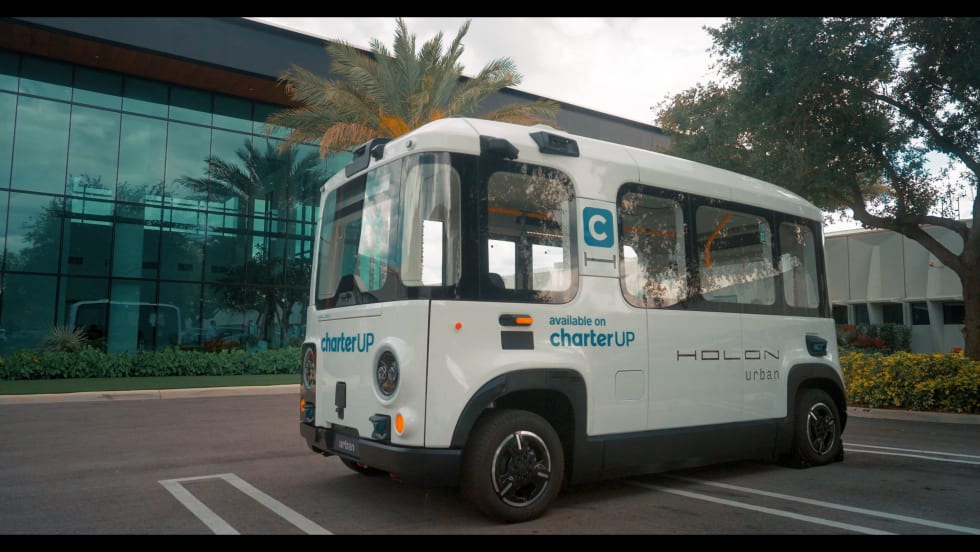
Vice President of New Mobility Stephen Joos discusses how CharterUP is leveraging its nationwide transportation network, technology platform, and autonomous vehicle partnerships to expand into workforce mobility, campus shuttles, and transit solutions.
From manufacturers and suppliers to transit agencies and motorcoach operators, these updates offer a snapshot of the projects, partnerships and business moves driving the industry forward.
In METRO's latest installment, we take a look at recent news from Transdev, Hitachi, and more partnerships making headlines across the transportation sector.
He plans to continue his work advancing innovative mobility solutions to improve the quality of life in communities across the nation. He did not announce specific plans.
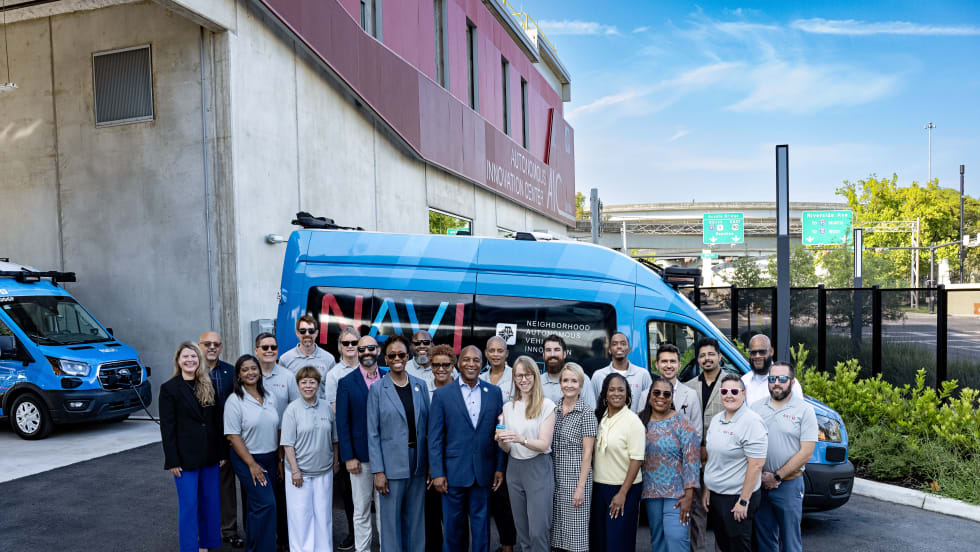
During its first year of operation, NAVI has transported over 15,200 passengers and traveled more than 61,000 miles in autonomous mode without a safety incident caused by the autonomous driving system.
The spending plan represents an increase of just 1.9% over the current year and includes investments in new buses, additional full-length fare gates, and other customer enhancements.
From manufacturers and suppliers to transit agencies and motorcoach operators, these updates offer a snapshot of the projects, partnerships and business moves driving the industry forward.