
Report: Transportation, housing costs outpacing incomes
Findings from the study by the Center for Housing Policy and the Center for Neighborhood Technology show that the combined costs of housing and transportation in the nation’s largest 25 metro areas have swelled by 44% since 2000 while incomes have failed to keep pace.

The combined costs of housing and transportation in the nation’s largest 25 metro areas have swelled by 44% since 2000 while incomes have failed to keep pace, according to a new report from the Center for Housing Policy — the research affiliate of the National Housing Conference — and the Center for Neighborhood Technology.
The report, Losing Ground: The Struggle of Moderate-Income Households to Afford the Rising Costs of Housing and Transportation, details the challenges that American households face as the combined costs of housing and transportation consume an ever-larger share of household incomes.
The report includes a special focus on moderate-income households, defined as those earning between 50% and 100% of the median household income in their area. In the 25 largest metro areas, the report finds that moderate-income households spend an average of 59% of their income on housing and transportation, leaving little for necessary expenses such as food, education and health care.
The report finds cost burdens to be highest in the Miami area, where moderate-income households spend 72% of their income on housing and transportation. The next highest burdens are in the Riverside-San Bernardino, Calif., area (69%); the Tampa, Fla. area (66%); and the Los Angeles area (65%).
“If we really want to understand whether housing is affordable, we need to consider housing and transportation costs together,” explains Center for Housing Policy Executive Director Jeffrey Lubell. “Along with utilities, which we include within housing costs, these are the true ‘costs of place,’ and our report shows they have grown much faster than incomes since 2000.”
The report finds that housing and transportation costs have increased 44% over this period while household incomes have risen only 25%. As a result, Americans are now substantially less able to afford their costs of place, undermining their ability to meet other critical household expenses, such as food, clothing, health insurance and child care.
Cost burdens have increased despite reductions in home sale prices caused by the major housing downturn that began in 2006. “Increased demand for rental housing combined with insufficient new production has raised rents,” continued Lubell, “while households with blemished credit and existing homeowners with underwater mortgages have been unable to take advantage of lower home prices. Add in the higher transportation costs associated with higher gas prices, stagnant or slowly growing wages and the loss of income associated with layoffs and it’s easy to see how Americans have lost ground.”
"Both housing and transportation costs need to be made more affordable,” notes Center for Neighborhood Technology President and Co-Founder Scott Bernstein. “Letting the public know that the full cost of a location includes both housing and transportation is a first step; targeting resources that lower the cost of transportation, such as improved public transportation, to areas where it will help America's working families, is also essential."
The report notes that there are many policies that local and state governments can adopt to help reduce housing costs in places where transportation costs are low or where public investments will make transportation more affordable in the future. Policy options include taking measures to preserve existing affordable housing, reforming restrictive regulations to lower the cost of creating new housing in such areas, and instituting requirements or incentives to include affordable housing as part of new development.
“Given the substantial increases that we expect in coming years in the demand for housing within walking distance of public transit,” explains Bernstein, “it will be essential to act proactively to ensure that affordable housing is preserved and included within new development in these areas.”
Key Findings include:
• Places where the combined housing and transportation cost burden is greatest are not always the places with the highest absolute costs. In some metro areas, such as Washington, D.C., Boston and San Francisco, high costs are matched by relatively high incomes, helping moderate-income households better afford their housing and transportation costs. But other regions, such as Riverside-San Bernardino, Calif., Los Angeles and San Diego, have high housing and transportation costs despite moderate to low median incomes, with average combined cost burdens for moderate-income households ranging from 63% to 69% of household income.
• Moderate-income households in the Miami metro area have the highest combined cost burdens, spending an average of 72% of income on housing and transportation. A second Florida metro area — Tampa — also has very high cost burdens, with moderate-income households spending an average of 66% of income on housing and transportation. To a large extent, the high cost burdens in both of these metro areas are driven by low incomes.
• Housing costs alone do not paint a complete picture of the total “cost of place.” The inclusion of transportation costs shifts the relative affordability of many metro areas. For example, housing costs in the Houston region are comparatively affordable for moderate-income households, ranking eighth out of the 25 regions examined, but adding in transportation costs drops Houston into 17th place in overall affordability. In contrast, metro areas such as San Francisco, Boston, and New York are some of the least affordable regions for moderate-income households when housing alone is considered, but are among the most affordable when housing and transportation costs are considered together.
• For moderate-income households, homeowners carry heavier cost burdens than renters. For the typical moderate-income renter in the 25 metro areas studied, housing and transportation costs consume an average of 55% of income. Moderate-income homeowners carrying a mortgage, however, face average costs of nearly 72% of income.
• Despite lower burdens than homeowners, moderate-income renters are still barely making ends meet in many metro areas. In the Los Angeles metro area, where average housing and transportation costs consume 61% of income for moderate-income renters, a typical renter household would not have enough money left over at the end of the month to pay the minimum costs of food, health care, and other basic necessities. This would suggest these households are either cutting corners on essentials, or accruing debt.
• Cost burdens for moderate-income households vary substantially within metro areas. Even in metro areas where average cost burdens are relatively affordable, there are many neighborhoods that are out of reach for moderate-income households. In the Philadelphia region, for example, moderate-income households are faced with average housing and transportation costs exceeding 90% of income in some neighborhoods.
More Bus
Biz Briefs: STV teams with Amtrak, Motorcoach Operators Boost Fleet and Land Contracts, and More
From manufacturers and suppliers to transit agencies and motorcoach operators, these updates offer a snapshot of the projects, partnerships and business moves driving the industry forward.
Read More →
LA Metro Marks Banner Year, Sets Ambitious Goals for New Fiscal Year
Incoming LA Metro Board Chair and Los Angeles Mayor Karen Bass joined outgoing Board Chair Fernando Dutra and LA Metro CEO Stephanie Wiggins to review accomplishments from fiscal year 2026, which included the opening of new rail extensions, advancement of major transit projects, expanded safety programs, and new rider amenities.
Read More →
DART Taps Nathaniel P. Ford Sr. as Next President/CEO
Since 2012, Ford has served as the CEO of the Jacksonville Transportation Authority
Read More →
AC Transit’s Cecil Blandon on Building the Next Generation of Transit Maintenance Leaders
The agency’s maintenance chief discusses leadership, workforce development, zero-emission technology, and preparing technicians for the future of public transportation.
Read More →
Building the Next Generation of Transit Technology
In this edition of METROspectives, Luminator CEO Magnus Friberg discusses the company's transformation, the growing role of AI and software, and what's next for transit technology.
Read More →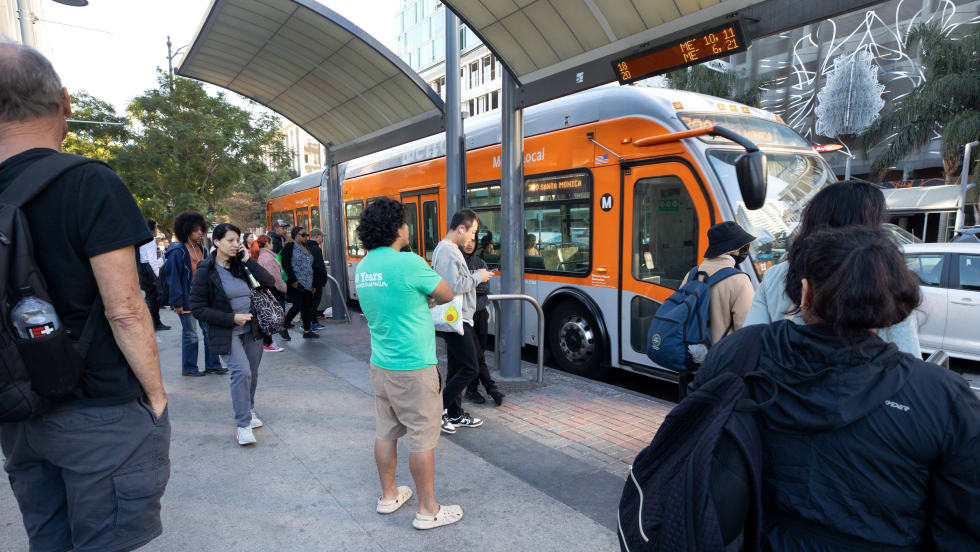
June LA Metro Ridership Surges 2 Million Year Over Year
Total June ridership increased for both weekdays and weekends. Weekday ridership was 953,820, which grew 8.4% from June 2025; Saturdays increased nearly 13% year-over-year to 708,826; and Sundays increased 7.7% to 611,534 from June 2025, according to LA Metro.
Read More →
Washington's Pierce Transit Board Sends Transit Funding Measure to November Ballot
With the adoption of Resolution 2026-006, the measure moves to the Pierce County Auditor, giving voters in the Pierce Transit service area the decision on whether to fund an expansion of local transit service within the agency’s service area.
Read More →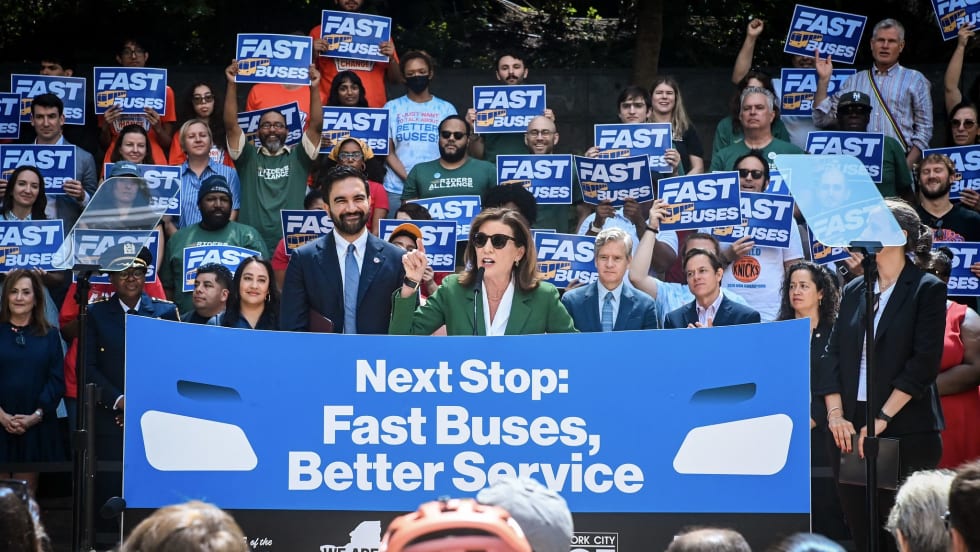
New York Unveils Sweeping Plan to Modernize City Bus Service
Next Stop: Fast Buses, Better Service identifies 50 priority bus corridors for improvements across the five boroughs and launches the City’s next generation of rapid bus service along five key routes.
Read More →
CTDOT Taps STV for Electric Bus Facility Design
The firm will work with CTDOT and RVT to define the facility layout, operational requirements, and long-term flexibility for RVT’s growing electric fleet.
Read More →
Ford to Leave JTA After More Than 10 Years as CEO
He plans to continue his work advancing innovative mobility solutions to improve the quality of life in communities across the nation. He did not announce specific plans.
Read More →