
TNCs caused half of San Francisco's congestion since 2010: Report
Employment and population growth were primarily responsible for the remainder of the worsening congestion.

TNCs caused increased congestion across all times of day, including the morning peak, mid-day, and evening peak, but the increase attributable to TNCs was most pronounced in the evening.
© Frank Schulenburg / CC BY-SA 3.0

The San Francisco County Transportation Authority released “TNCs & Congestion,” a report providing the first comprehensive analysis of how Transportation Network Companies (TNCs) Uber and Lyft collectively have affected roadway congestion in San Francisco.
The report found that TNCs accounted for approximately 50% of the rise in congestion in San Francisco between 2010 and 2016, as indicated by three congestion measures: vehicle hours-of-delay, vehicle-miles traveled, and average speeds. Employment and population growth were primarily responsible for the remainder of the worsening congestion. As a share of total congestion citywide, TNCs account for an estimated 25%.
The TNCs and Congestion report follows the agency’s 2017 “TNCs Today” report that quantified the number and distribution of local TNC trips in San Francisco.
Major findings show that collectively the ride-hail services accounted for:
Fifty-one percent of the increase in daily vehicle hours of delay between 2010 and 2016.
Forty-seven percent of the increase in vehicle miles traveled during that same time period.
Fifty-five percent of the average speed decline on roadways during that same time period.
On an absolute basis, TNCs comprise an estimated 25% of total vehicle congestion (as measured by vehicle hours of delay) citywide and 36% of delay in the downtown core.
Notably, the report indicates that TNC activity affects congestion differently throughout the day and throughout the city. TNCs caused increased congestion across all times of day, including the morning peak, mid-day, and evening peak, but the increase attributable to TNCs was most pronounced in the evening.
Consistent with prior findings from the Transportation Authority’s 2017 TNCs Today report, TNCs also caused the greatest increases in congestion in the densest parts of the city — up to 73% in the downtown financial district — and along many of the city’s busiest corridors. TNCs had little impact on congestion in the western and southern San Francisco neighborhoods.
The report also found that changes to street configuration, such as when a traffic lane is converted to a bus-only lane, contributed less than 5% to congestion.
“This report further quantifies the impact ride-hail services have on our streets,” said Aaron Peskin, chair of the San Francisco County Transportation Authority (SFCTA) and District 3 Supervisor. “It underscores the importance of our current collaboration with Transportation Network Companies to develop a per-trip tax to help mitigate the impacts of these trips, and informs our efforts to balance the availability of these new mobility options with our Transit First policies.”
How is congestion measured?
The TNCs and Congestion report uses the following common measures of roadway congestion:
Vehicle Hours-of-Delay: Measuring the overall amount of excess time spent in congestion, it is the difference between congested travel times and free flow travel times on a given roadway segment.
Vehicle-Miles Traveled: A measure of the overall amount of travel, as measured in distance, that occurs on the streets.
Speed: The average speeds on streets.
More New Mobility
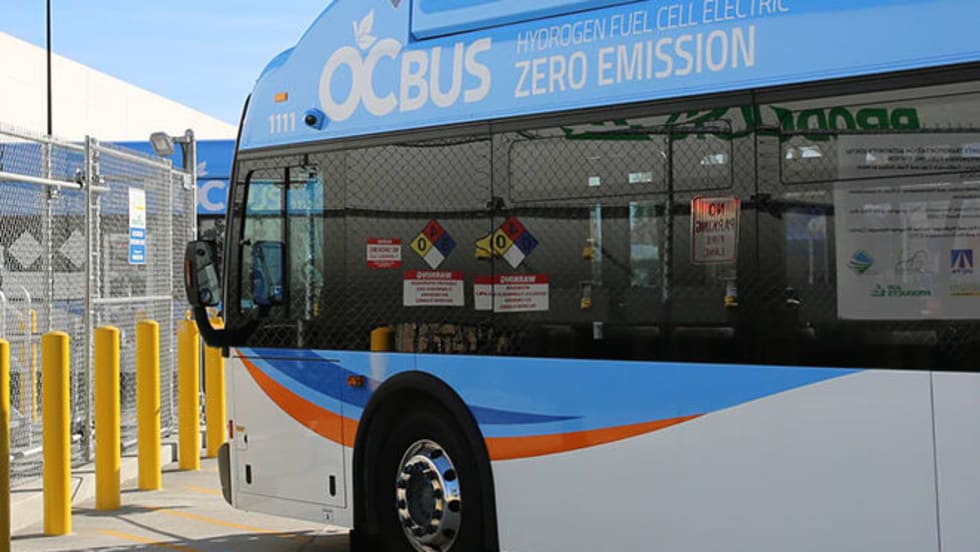
Biz Briefs: OCTA Taps Clean Energy for Hydrogen Station, Stadler to Supply Via Rail Vehicles, and More
From manufacturers and suppliers to transit agencies and motorcoach operators, these updates offer a snapshot of the projects, partnerships and business moves driving the industry forward.
Read More →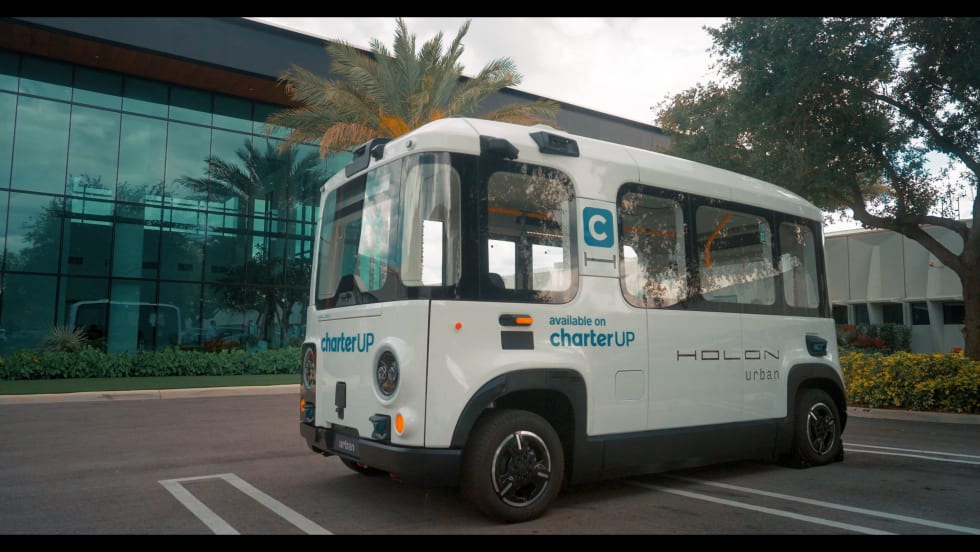
CharterUP Expands Into New Mobility and Autonomous Transportation
Vice President of New Mobility Stephen Joos discusses how CharterUP is leveraging its nationwide transportation network, technology platform, and autonomous vehicle partnerships to expand into workforce mobility, campus shuttles, and transit solutions.
Read More →
METRO Magazine Announces 2026 Innovative Solutions Awards Winners
Projects Recognized for Advancing Mobility Through Technology, Accessibility, Workforce Innovation, and Operational Excellence
Read More →Biz Briefs: STV teams with Amtrak, Motorcoach Operators Boost Fleet and Land Contracts, and More
From manufacturers and suppliers to transit agencies and motorcoach operators, these updates offer a snapshot of the projects, partnerships and business moves driving the industry forward.
Read More →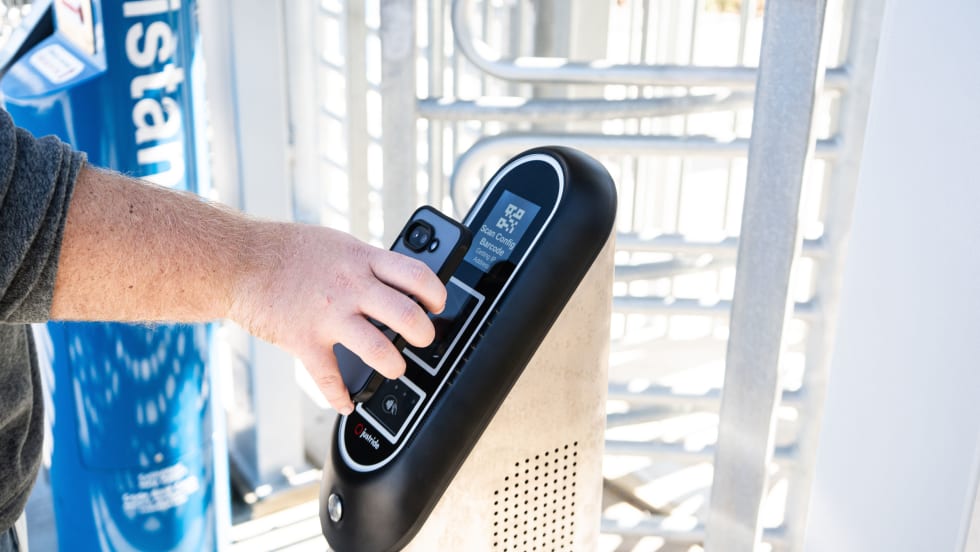
Biz Briefs: Masabi Teams with St. Louis Metro and More
In METRO's latest installment, we take a look at recent news from Transdev, Hitachi, and more partnerships making headlines across the transportation sector.
Read More →
Microtransit's Next Test: Becoming Part of the Network
Freebee shows how electric microtransit is moving beyond pilots to fill network gaps, connect riders to transit, and prove lasting value.
Read More →
Ford to Leave JTA After More Than 10 Years as CEO
He plans to continue his work advancing innovative mobility solutions to improve the quality of life in communities across the nation. He did not announce specific plans.
Read More →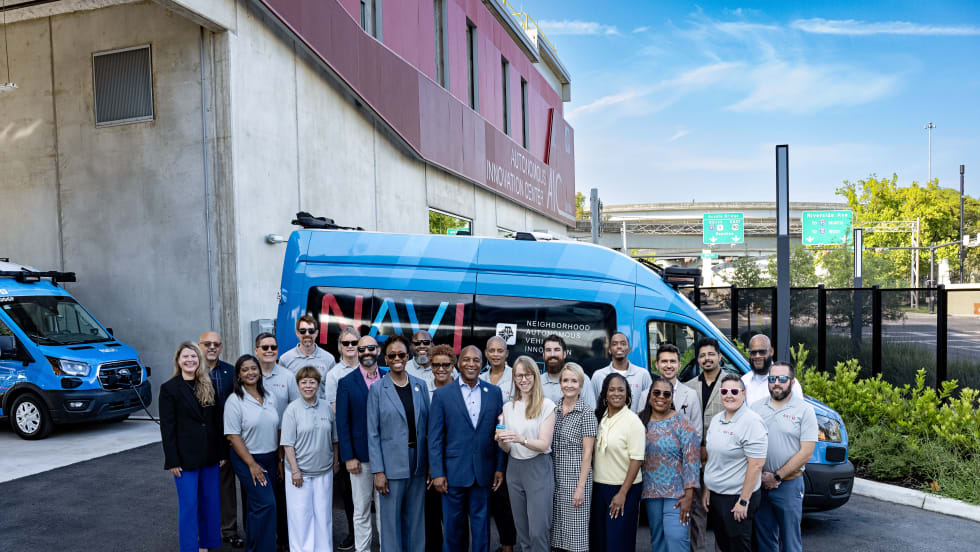
Florida's JTA Marks One Year NAVI Anniversary
During its first year of operation, NAVI has transported over 15,200 passengers and traveled more than 61,000 miles in autonomous mode without a safety incident caused by the autonomous driving system.
Read More →
SEPTA Board Approves FY2027 Budget Amid Funding Challenges
The spending plan represents an increase of just 1.9% over the current year and includes investments in new buses, additional full-length fare gates, and other customer enhancements.
Read More →
Biz Briefs: Endera Delivers to California, Safety Vision Teams with San Antonio's VIA, and More
From manufacturers and suppliers to transit agencies and motorcoach operators, these updates offer a snapshot of the projects, partnerships and business moves driving the industry forward.
Read More →