
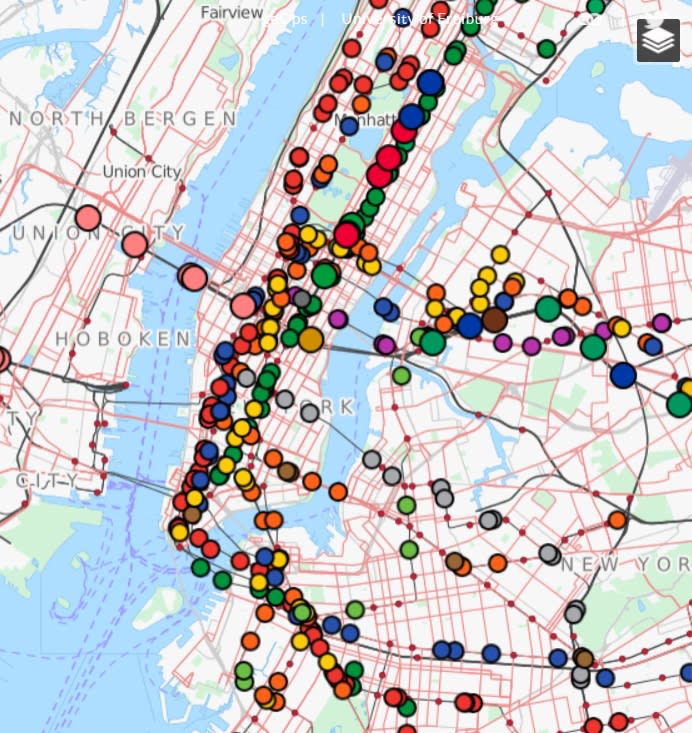
University student creates new tool for visualizing transit
Transit Visualization Client, or TRAVIC, takes public data from 249 transportation networks, across five continents, and puts them onto one, animated map.

TRAVIC

WASHINGTON, D.C. — CityLab reported on a German university student who developed a new tool for visualizing public transit in a more system-oriented way.
Transit Visualization Client, or TRAVIC, takes public data from 249 transportation networks, across five continents, and puts them onto one, animated map. Some data point movements correspond to schedules, not real-time realities, making it a quasi-utopia of uninterrupted transit.
Aside from offering a broad look at the movements of global transit networks, TRAVIC offers a unique opportunity to analyze how these systems work. For the full story and to see examples of maps, click here.
More Bus
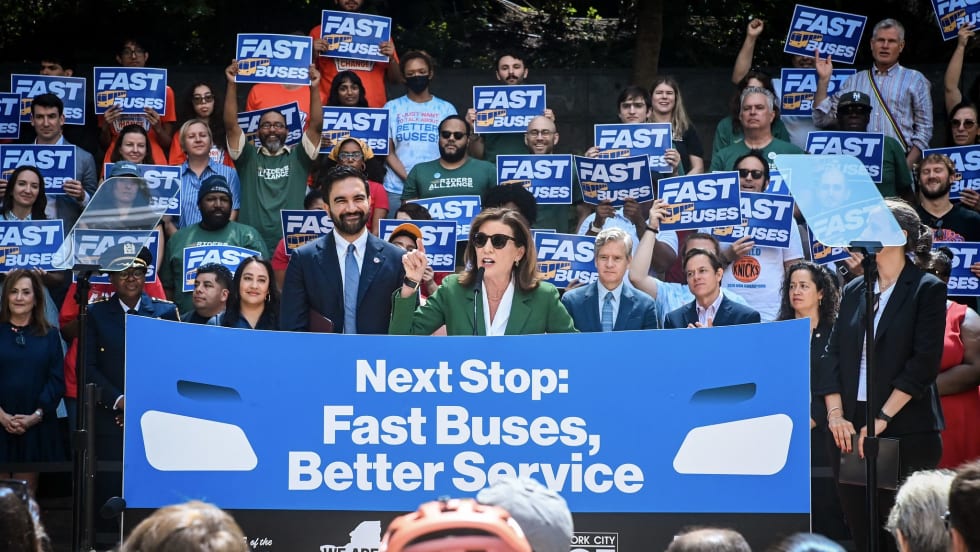
New York Unveils Sweeping Plan to Modernize City Bus Service
Next Stop: Fast Buses, Better Service identifies 50 priority bus corridors for improvements across the five boroughs and launches the City’s next generation of rapid bus service along five key routes.
Read More →
CTDOT Taps STV for Electric Bus Facility Design
The firm will work with CTDOT and RVT to define the facility layout, operational requirements, and long-term flexibility for RVT’s growing electric fleet.
Read More →
Ford to Leave JTA After More Than 10 Years as CEO
He plans to continue his work advancing innovative mobility solutions to improve the quality of life in communities across the nation. He did not announce specific plans.
Read More →
Transit Leaders Push for Bus Procurement Reforms to Reduce Costs
Industry experts said reducing unnecessary bus customization and modernizing purchasing practices could help transit agencies buy more vehicles, improve reliability, and make better use of limited funding.
Read More →
Executive Order Aims to Improve Transit Access Across California
The order directs state agencies to streamline transit project delivery, improve coordination, and expand access to bus and passenger rail services across California.
Read More →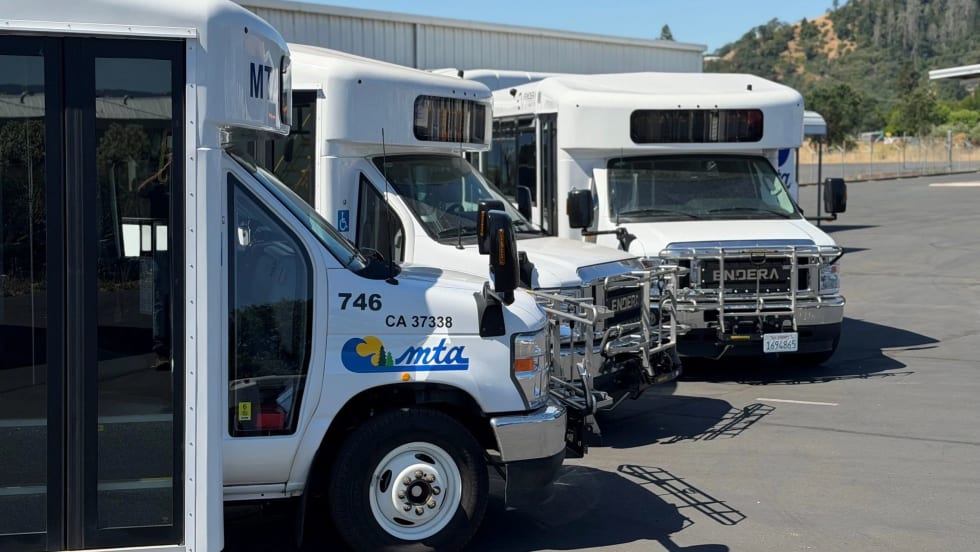
Biz Briefs: Endera Delivers to California, Safety Vision Teams with San Antonio's VIA, and More
From manufacturers and suppliers to transit agencies and motorcoach operators, these updates offer a snapshot of the projects, partnerships and business moves driving the industry forward.
Read More →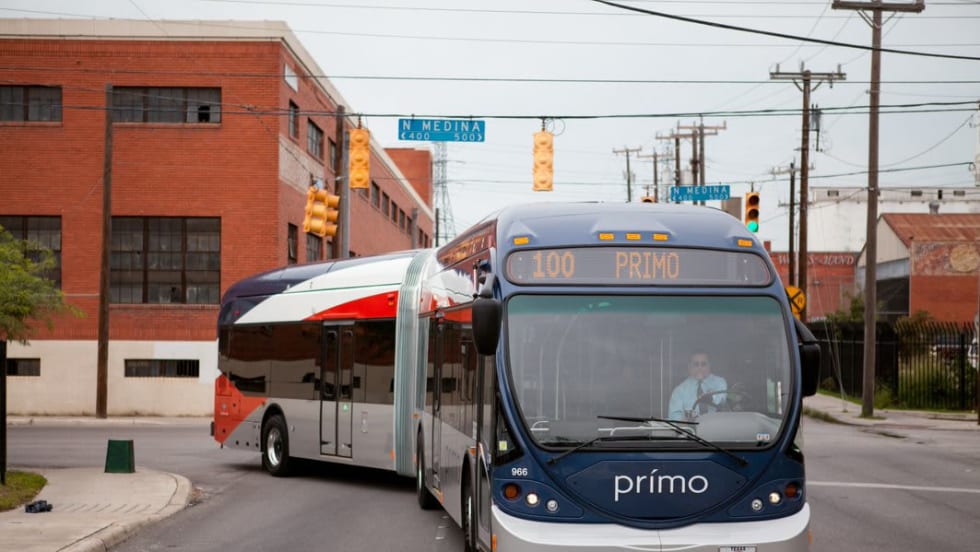
VIA's Silver Line Clears Environmental Review, Advances Toward Construction
The VIA Rapid Green Line is currently under construction, with service expected to begin in April 2028.
Read More →
Modernizing Mobility with CharterUP CEO Armir Harris
From digital transformation to evolving customer demands, CharterUP's Armir Harris offers his perspective on the transportation industry's next chapter.
Read More →
CTTC Enhances Transit Workforce Pipeline Through New Partnerships and Leadership
The group's latest initiatives focus on developing talent, expanding training opportunities and addressing workforce needs across the transit sector.
Read More →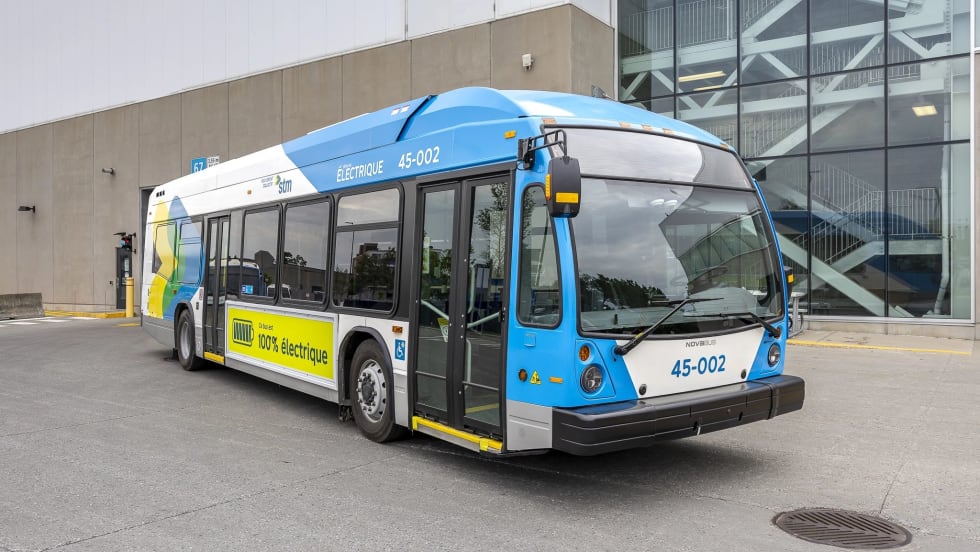
Biz Briefs: Montréal Debuts Nova Electric Buses and More
In this edition of Biz Briefs, we spotlight the latest developments shaping the future of mobility.
Read More →