Metro Magazine

 MENU
 SEARCHMENUSEARCH
Loading data...

As more Washington State University students ride the bus, Pullman Transit has had to use supplemental buses to alleviate congestion and reliability problems.
Read More →
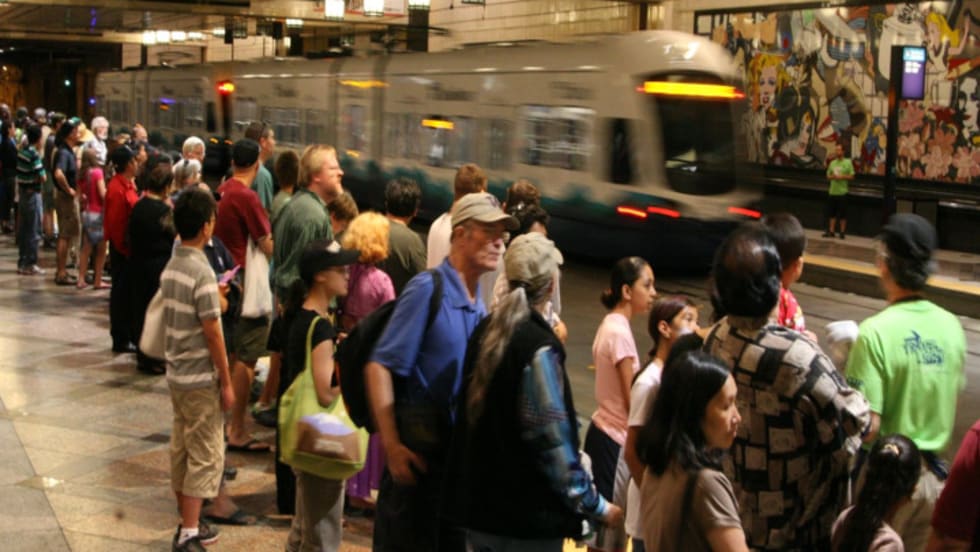
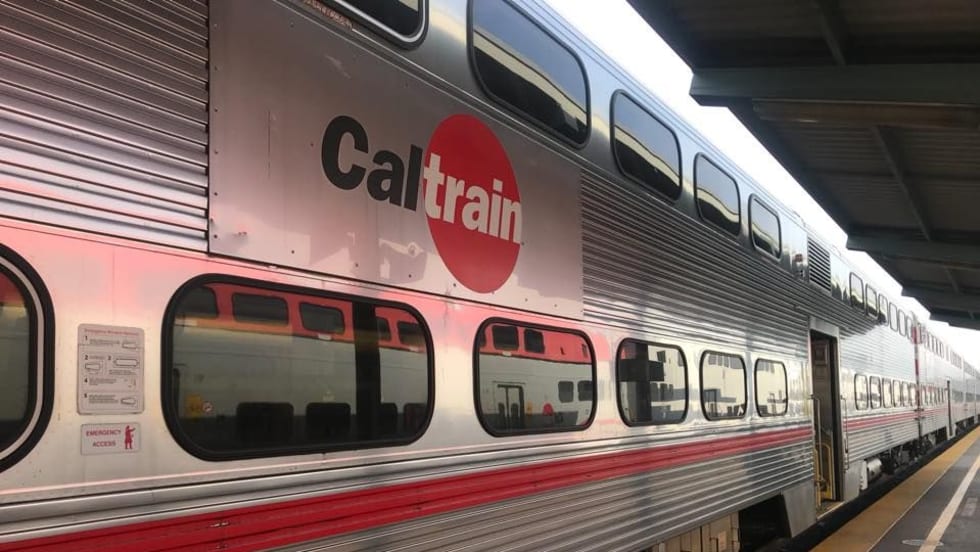
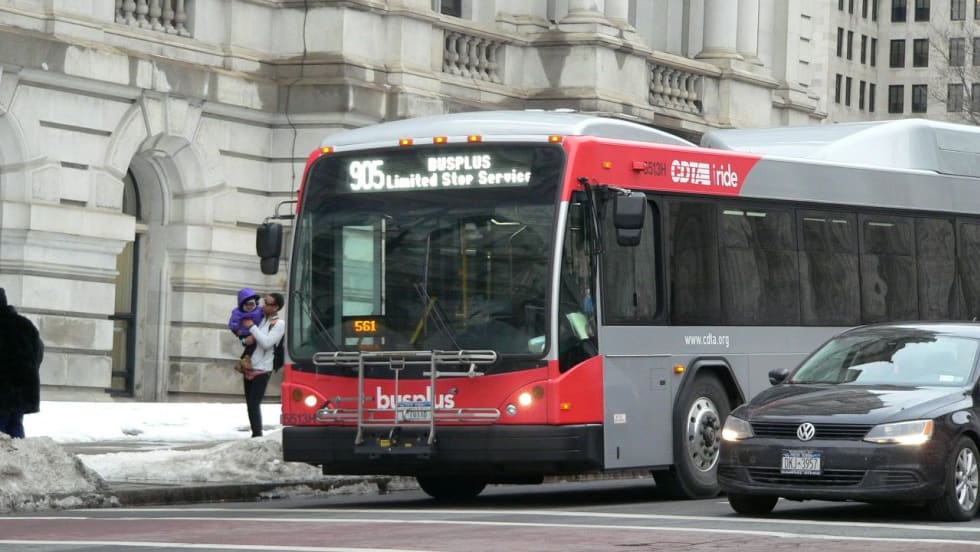
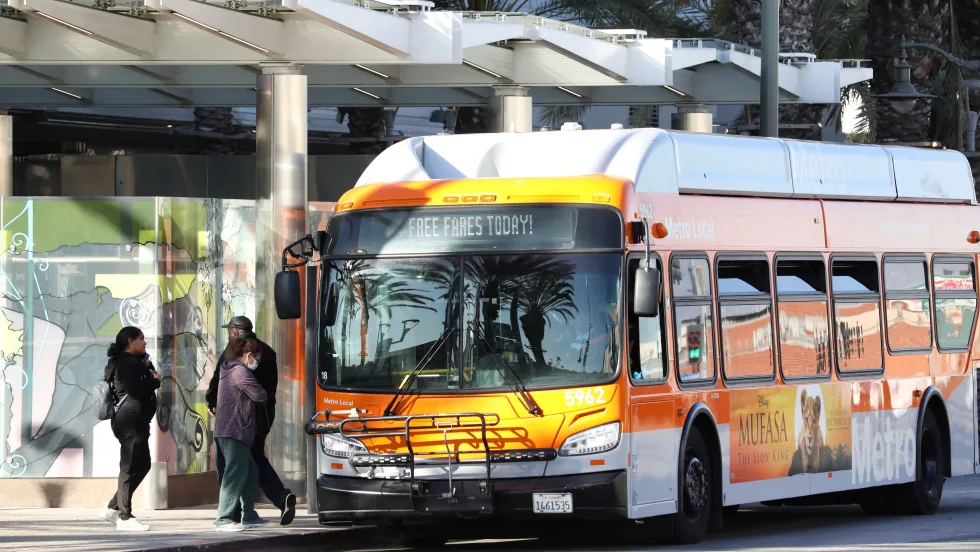
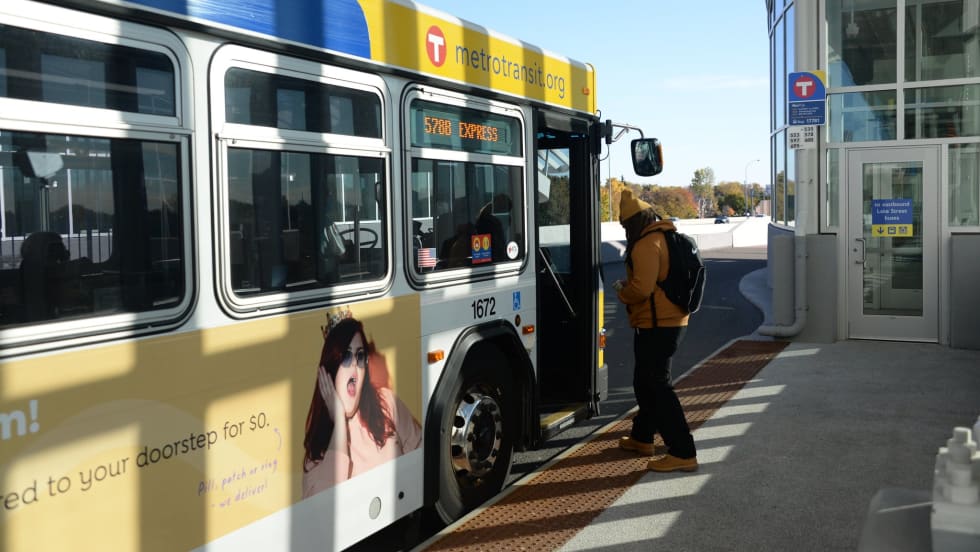
Overall, subway and bus ridership dropped by 5.6% in March 2018, compared to the previous, which is the biggest year-over-year drop since December 2017.
Read More →Report finds 10.5 billion trips, the second highest ridership since 1957, equals 154 million more trips than the previous year.
Read More →Carried an estimated average of 12,000 riders each weekday during the first week of service. Another estimated 16,900 riders took Link on Saturday and 15,100 on Sunday.
Read More →Previous to this quarter's ridership increase, public transit use had declined in the past five quarters due to high unemployment, the economic recession, and lower state and local revenue. Demand response (paratransit) increased in the second quarter of 2010 by 1.6 percent.
Read More →The four weekdays after Labor Day brought the largest jump in ridership since March 2020, with an average increase of 17% when compared to an average weekday in August.
Read More →Riders will be eligible to compete in special public transit challenges to earn additional rewards, such as Amazon or Starbucks gift cards
Read More →Nearly 15.7 million boardings were recorded, a 5% increase from last year, which was reinforced by 26 consecutive months of month-to-month ridership increases. Revenue from customers was 6% higher this year as compared to last year. Growth took off with the introduction of the agency’s new BRT system.
Read More →Metro’s average weekday boardings reached 80.7% of 2019 pre-pandemic levels and on the weekends, ridership attained 93.1% of its pre-pandemic level.
Read More →The rise in ridership is reflective of transit agencies adapting to the swiftly changing needs of their communities while delivering safe, reliable service, according to APTA.
Read More →