
APTA, Transit App Unveil New Ridership Trends Dashboard
Transit’s team also analyzes route-level and system-wide origin-destination data, to provide transit agencies with up-to-date information about rider demand in its Transit Dashboard.
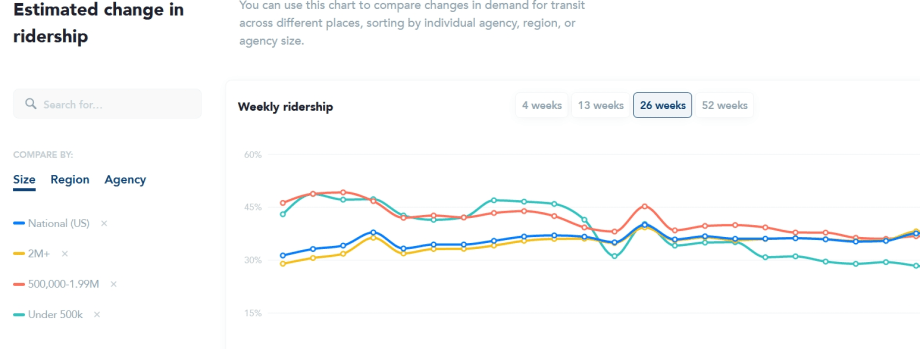
Screenshot via APTA/Transit
The American Public Transportation Association (APTA) and the Transit app released the APTA Ridership Trends dashboard, a new resource providing up-to-date, week-by-week estimations of public transit ridership for agencies across the U.S. The dashboard is available here.
During the COVID-19 pandemic, public transit ridership has risen and fallen rapidly in response to public health alerts across the country. These changes make it difficult for public transit agencies that rely on monthly or quarterly reporting to follow up-to-date ridership trends and benchmark against their peers. To tackle this challenge, APTA and the Transit app have partnered to build a new resource for the entire industry, tracking demand for public transit and publishing estimates of ridership change in real time.
“APTA is excited to announce this new partnership with the Transit app,“ said APTA President and CEO Paul P. Skoutelas. “Agencies around the country need up-to-date information to help them make critical business decisions during this unprecedented pandemic. This new partnership will benefit our members and riders all around the nation.”
“We work hand-in-hand with transit agencies around the country every day,” said David Block-Schachter, chief business officer of Transit. “Agencies are looking for new, faster ways to gather data to respond to rider demand. The number of people using our app for transit information is a great barometer for estimating overall ridership in near real-time. Together with APTA, we’ve been able to refine this data to provide insights to the entire industry.”
Transit’s team also analyzes route-level and system-wide origin-destination data, to provide transit agencies with up-to-date information about rider demand in its Transit Dashboard.
User surveys by Transit have shown the demographics of its users to be broadly reflective of public transit ridership at large in the U.S., including during the pandemic. The company has provided a real-time tracker of public transit demand on its website since the start of the pandemic, and found its demand indicators to track closely with actual ridership statistics.
Estimated values for each week are statistically modelled based on measures of Transit app usage, and do not represent actual reported ridership counts from agencies. App usage is attributed to a particular transit agency if that agency’s service appears as a nearby option for the user when they open the app.
Transit app usage statistics count the frequency of how often the app is opened, providing a measure of demand for public transit, and take into account additional factors such as regional trends and current severity of the pandemic.
More New Mobility

Modernizing Mobility with CharterUP CEO Armir Harris
From digital transformation to evolving customer demands, CharterUP's Armir Harris offers his perspective on the transportation industry's next chapter.
Read More →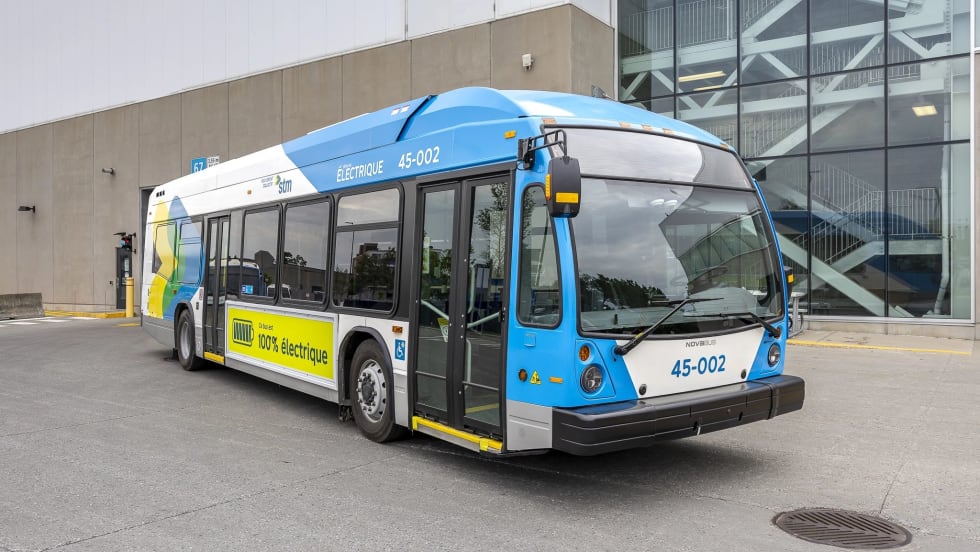
Biz Briefs: Montréal Debuts Nova Electric Buses and More
In this edition of Biz Briefs, we spotlight the latest developments shaping the future of mobility.
Read More →
6 Transit Management Lessons for Colleges and Universities Facing Seasonal Demand Swings
College transportation demand swings wildly throughout the year. Fleet strategies are starting to catch up.
Read More →
METROspectives: CharterUP CEO Armir Harris on Modernizing Mobility
From digital transformation to evolving customer demands, CharterUP's CEO Armir Harris offers his perspective on the transportation industry's next chapter.
Read More →Joshua Schank on Transportation Innovation, Risk, and the Future of Mobility
In this edition of METROspectives, Joshua Schank discusses lessons from launching LA Metro’s Office of Extraordinary Innovation, the challenges of advancing new mobility technologies, and much more.
Read More →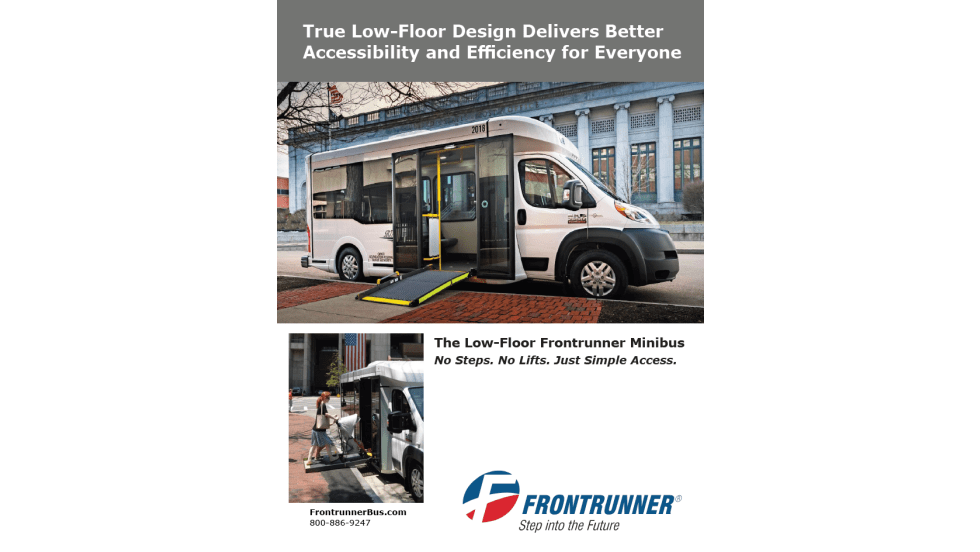
Low-Floor vs. High-Floor Cutaway vs. Modified Van: How 3 Accessible Minibus Designs Compare
As transit demands evolve, so should your fleet. Download the whitepaper to see how the Low-Floor Frontrunner Minibus compares to traditional options.
Read More →
Joshua Schank on Transportation Innovation, Risk, and the Future of Mobility
In this edition of METROspectives, the co-author of New Tricks for Old Bureaucracies, discusses lessons from launching LA Metro’s Office of Extraordinary Innovation, the challenges of advancing new mobility technologies, and much more.
Read More →
Biz Briefs: Foothill Gold Line Award, Matawan Contract, and More
From strategic partnerships to acquisitions and service expansions, the industry continues to evolve at a rapid pace. Find out all the latest here.
Read More →
Inside Look: EMBARK Expands Fare-Free Transit Program Through New Public-Private Partnership
The OKC transit agency says sponsorship helps subsidize the Third Friday Free initiative while reducing barriers for first-time riders and boosting ridership across buses, streetcars, and river cruises.
Read More →
2026 METRO Buyer’s Guide & Directory
Searching for the right vehicles, technology, equipment, or services for your public transit or motorcoach operation? This industry guide brings together manufacturers and suppliers from across the transportation market — all in one place. Download it to connect with the companies that help agencies and operators improve mobility, enhance operations, and move their organizations forward.
Read More →