
Travel Patterns Study Shows Public Transit Volume Still Lagging in New York Region
Created annually and each quarter year since 2002, NYMTC's Travel Patterns Reports measure ridership on buses, rails, subways, and ferries along with the vehicular traffic crossing the area's waterway bridges and tunnels in New York City, Long Island, the Lower Hudson Valley, and Northern New Jersey.


Bus and rail ridership during the fourth quarter of 2023 also showed an upswing compared to the same period in 2022.
Photo: LIRR
Increased vehicle river crossings and a growing use of public transportation were among the highlights of the New York Metropolitan Transportation Council’s (NYMTC) Travel Patterns Fourth Quarter 2023 report.
Created annually and each quarter year since 2002, the Travel Patterns Reports measure ridership on buses, rails, subways, and ferries along with the vehicular traffic crossing the area's waterway bridges and tunnels in New York City, Long Island, the Lower Hudson Valley, and Northern New Jersey.
Report Findings
Vehicle traffic volume — which includes all motorized vehicles — at the 23 major river crossings documented in Travel Patterns was up 2.6%, or 55,000 vehicles, during the fourth quarter of 2023 compared to the same period in 2022.
Significant increases in traffic were noted at the Brooklyn Bridge (20.1%), the Ed Koch Queensboro Bridge (8.1%), and the Throgs Neck Bridge (7.5%). However, the total number of vehicles using these crossings in 2023 remains 4.1% below the pre-Covid levels of 2019, the study reported.
Bus and rail ridership during the fourth quarter of 2023 also showed an upswing compared to the same period in 2022, with the most significant increase in passenger volume coming from the Port Authority Trans-Hudson (PATH) Rail (37.6%); the Orange County buses (34.8%); the JFK AirTrain (34.3%), and the MTA Long Island Rail Road (19.2%).
Across the board, all public transportation ridership was up an average of 6.4% (6.5% when including ferries) — or 413,000 additional trips — during the fourth quarter of 2023 compared to 2022. However, Travel Patterns reported that passenger volume on public transit still trails 32% below the pre-COVID of 2019 during the fourth quarter, representing about 3.2 million trips.
Ferry ridership on the 38 routes measured in Travel Patterns during the fourth quarter of 2023 gained an additional 13% in passenger volume from the same period in 2022, averaging 83,280 passengers per month during October, November, and December. It is worth noting that several of these routes didn’t exist or operate during 2022’s fourth quarter, and this was even more pronounced in 2019.
“One of the many uses Travel Patterns has for us, our members, and the public is that it allows us to track route usage in our area and anticipate future needs for funding,” said Adam S. Levine, executive director of NYMTC. “This is key since anyone taking public transportation in the New York metropolitan area can see that it is on its way to returning to pre-Covid levels.”
NYMTC Study
Travel Patterns’ reports for the first, second, and third quarters of 2023 — as well as all quarters dating back to 2002 — are available on the NYMTC website.
The study is one of many sources of transportation research and data available through NYMTC, including its Socioeconomic and Demographic (SED) Forecasts, the Hub Bound Travel report, the Transportation Information Gateway (TIG), and the New York Best Practice Model.
More Management

Modernizing Mobility with CharterUP CEO Armir Harris
From digital transformation to evolving customer demands, CharterUP's Armir Harris offers his perspective on the transportation industry's next chapter.
Read More →
CTTC Enhances Transit Workforce Pipeline Through New Partnerships and Leadership
The group's latest initiatives focus on developing talent, expanding training opportunities and addressing workforce needs across the transit sector.
Read More →
San Diego MTS Keeps Service Intact With New FY 2027 Budget
The approved spending plan avoids route cuts and lays the groundwork for addressing transit funding challenges through the end of the decade.
Read More →
Solving The Driver Shortage: What Transit Agencies Can Learn From the Trucking Industry
See how transit agencies facing persistent driver shortages can learn from the trucking industry’s evolving strategies for recruitment, retention, workplace conditions, and more.
Read More →
FIFA World Cup Matches Are Driving Record Transit Ridership Nationwide
See how World Cup matches are generating record transit demand across North America, with ridership surpassing Super Bowls, concerts, and Olympic-era events.
Read More →
The Hidden Cost of Fuel Data Inaccuracy in Public Transit Fleets
In today's transit environment, accurate fuel and mileage data are critical to reducing costs, minimizing downtime, and improving fleet performance.
Read More →
Virginia's $28.5B Transportation Plan Targets Transit and Rail
Approved by the Commonwealth Transportation Board, the program supports ongoing infrastructure projects while providing new investments in transit, state of good repair and transportation alternatives.
Read More →
Latinos In Transit Seeks Host Organization for 2027 Leadership Summit
The selected host organization will showcase its transit system, projects, and community while welcoming hundreds of industry leaders and emerging professionals during Hispanic Heritage Month.
Read More →
Bipartisan BUSES Act Seeks Changes to New York City's Bus Idling Enforcement Program
Backed by motorcoach operators, the legislation seeks to balance emissions goals with passenger safety by allowing limited idling for inspections, accessibility needs and extreme weather conditions.
Read More →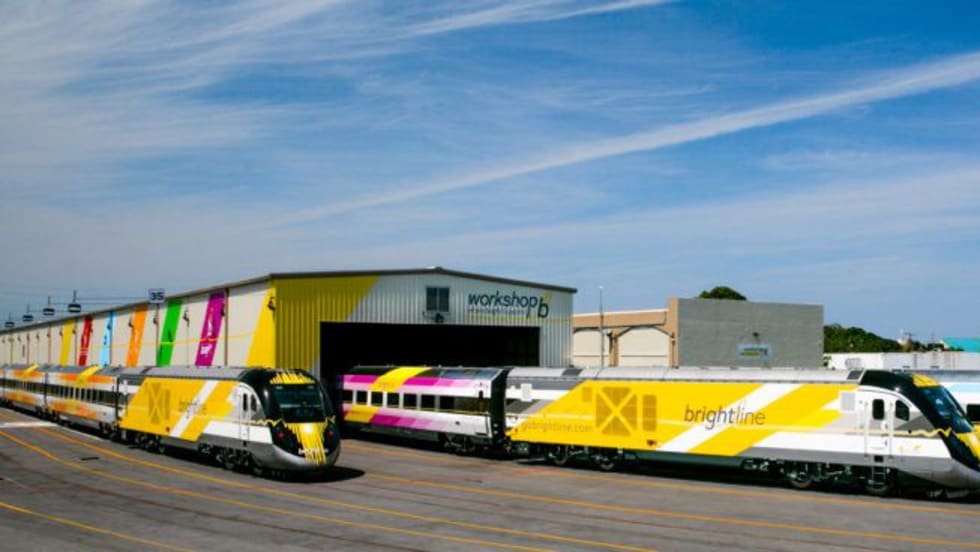
DOT: Brightline Corridor Incidents Fall 30% Following Federal Safety Upgrades
Safety improvements funded through a $25 million federal investment are credited with reducing trespassing and train-vehicle collisions along the Brightline Florida corridor.
Read More →