
Lytx report finds most risky driving trends in public transit
Findings include the five risky behaviors seen most often among transit drivers, most improved driving behaviors, and insights on how transit habits compare to those of other industries.

From its database of 808,000 risky driving events captured from transit fleets in 2019, Lytx® released new insights into transit industry driving trends.
Lytx’s findings include the five risky behaviors seen most often among transit drivers, most improved driving behaviors, and insights on how transit industry driving habits compare to those of other industries.
The data was captured from fleets of all sizes and types within the transit industry, including taxi, limousine, airport shuttle, coach, and school bus fleets, among others. It is part of an ongoing series from Lytx highlighting key behavior trends seen across the nine industries that utilize its video telematics technology, with the goal of informing and supporting ongoing safety efforts in the industries it serves.
The data will be released twice weekly through May 26 here.
Most Prevalent Risky Behaviors in 2019
Late response*
Near collision
Incomplete stop
Following distance**
Driver unbelted
Most Improved Behaviors from 2018 to 2019
Failure to stop*** – improved 32%
Posted speed violation – improved 24%
Late response* – improved 10%
Behaviors may appear on both the "Most Prevalent" and "Most Improved" lists. This demonstrates that even with significant improvement, fleets and drivers must stay vigilant and maintain awareness to keep those behaviors trending downwards.
How Transit Fleets Stack Up Against Other Industries
Lytx compared the prevalence of behaviors seen in transit fleets against behavior averages of fleets across all its other protected industries. Comparatively, transit fleets stood out in the following areas:
Near collision/near collision (unavoidable) occurred 31% more often
Incomplete stop occurred 18% more often
Food/drink observed 60% less often
Common risky driving behaviors observed within a fleet, as well as benchmarking data from fleets both inside and outside of a specific industry are helpful metrics for understanding industry-specific challenges, guiding safety efforts and then measuring success. To better identify and address top areas of driving risk within their individual fleets, thousands of organizations use the best-in-class Lytx Driver Safety Program; these organizations experience on average up to 50% reduction in collisions and up to 80% on associated claims costs as a result.
Lytx also found that 57% of high-impact collisions in the transit industry were attributed to fundamentals or traffic violation behaviors, such as “failure to stop” or “too fast for conditions,” indicating an opportunity for increased operator and driver coaching in this area.
*Late response occurs when a driver is not distracted, yet responds late and abruptly to a readily visible risky situation ahead.
**Following distance refers to a risky driving event in which the distance to the vehicle directly ahead is approximately 1.5 seconds and not increasing for at least 4 consecutive seconds.
***Failure to stop occurs when a driver fails to stop at a stop sign or his/her speed remains above 5 mph.
More Security and Safety
FTA Launches 'Transit Moves America' Dashboard to Highlight Agency Safety and Performance
The online dashboard transforms National Transit Database information into a public-facing resource that allows users to compare transit agencies on key operational and safety metrics.
Read More →
LA Metro Marks Banner Year, Sets Ambitious Goals for New Fiscal Year
Incoming LA Metro Board Chair and Los Angeles Mayor Karen Bass joined outgoing Board Chair Fernando Dutra and LA Metro CEO Stephanie Wiggins to review accomplishments from fiscal year 2026, which included the opening of new rail extensions, advancement of major transit projects, expanded safety programs, and new rider amenities.
Read More →
Building the Next Generation of Transit Technology
In this edition of METROspectives, Luminator CEO Magnus Friberg discusses the company's transformation, the growing role of AI and software, and what's next for transit technology.
Read More →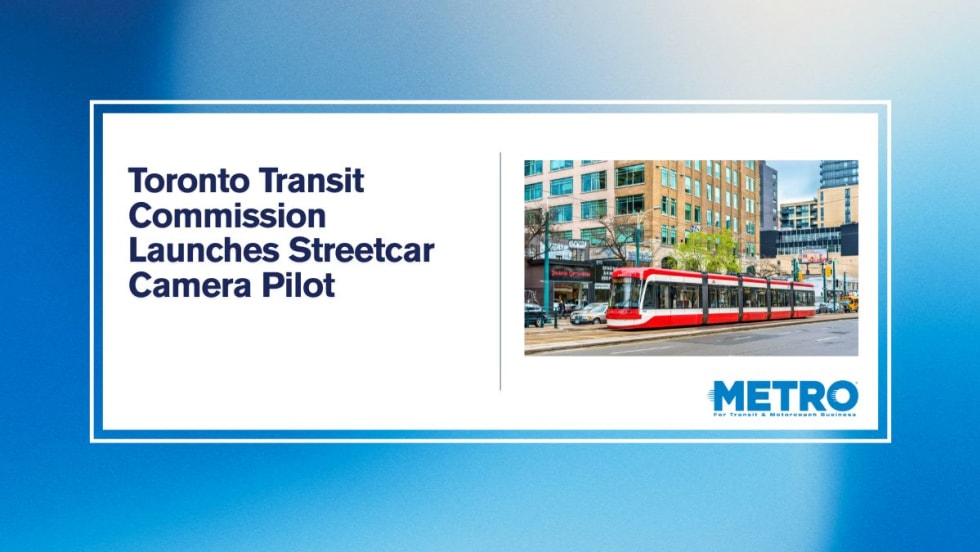
TTC Launches Camera Pilot to Curb Illegal Passing of Streetcars
During the pilot, the cameras will measure how often illegal streetcar passing occurs and test the technology's reliability for future automated enforcement.
Read More →
Biz Briefs: Masabi Teams with St. Louis Metro and More
In METRO's latest installment, we take a look at recent news from Transdev, Hitachi, and more partnerships making headlines across the transportation sector.
Read More →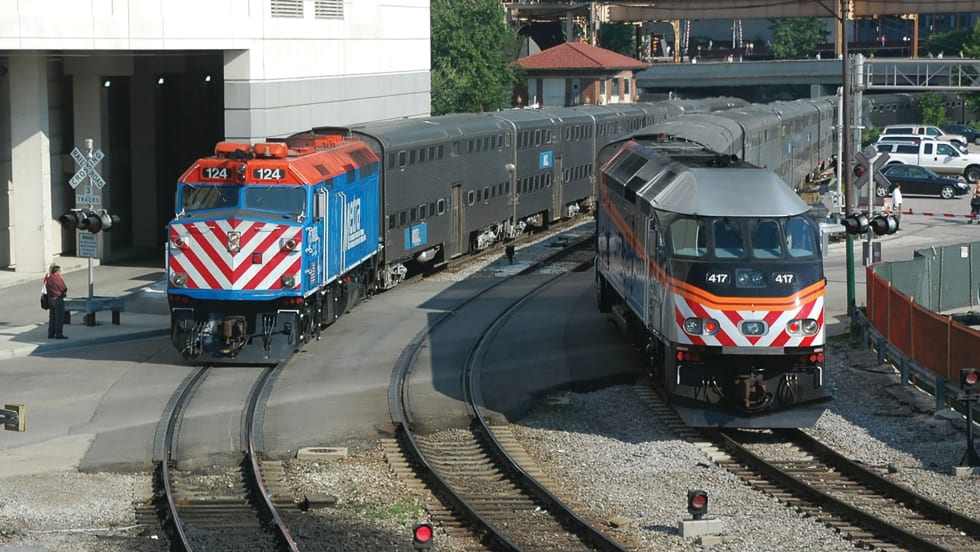
Metra Begins Drone Pilot Project to Boost Safety and Security
The project is funded through a $620,000 grant from FEMA’s Transit Security Grant Program, which provides transit agencies with funding for projects intended to protect critical transportation infrastructure and the traveling public.
Read More →
Building the Next Generation of Transit Technology
In this edition of METROspectives, Luminator CEO Magnus Friberg discusses the company's transformation, the growing role of AI and software, and what's next for transit technology.
Read More →
APTA Recognizes Excellence in Rail Safety and Security at 2026 Rail Conference
Nominations are evaluated on four criteria: effectiveness, benefit level, innovation, and transferability.
Read More →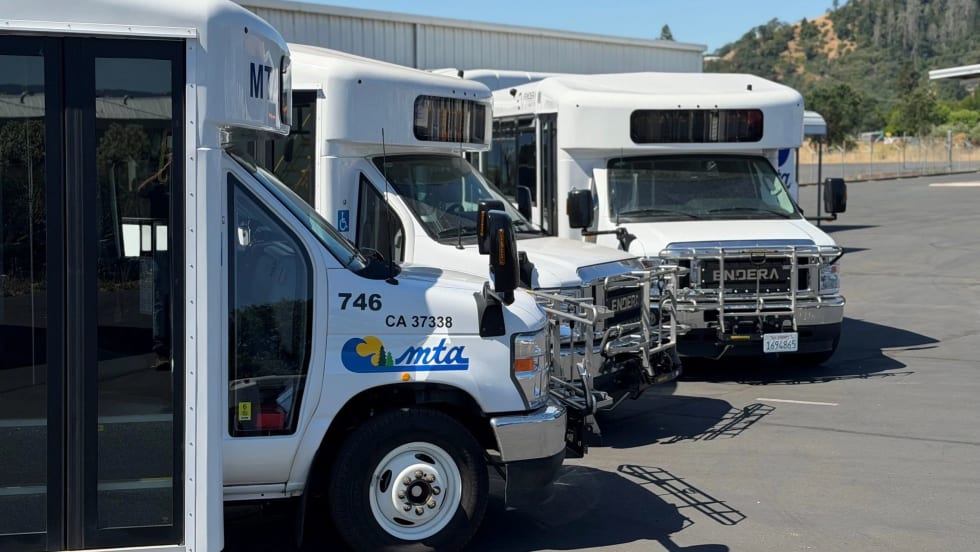
Biz Briefs: Endera Delivers to California, Safety Vision Teams with San Antonio's VIA, and More
From manufacturers and suppliers to transit agencies and motorcoach operators, these updates offer a snapshot of the projects, partnerships and business moves driving the industry forward.
Read More →
The Role of AI in Public Safety for Smart Transit Systems
As transit systems generate more data than ever, AI-powered safety tools are helping agencies detect incidents faster, improve response times and enhance situational awareness.
Read More →