
'Super Commuters' who travel 90-plus mins. to get to work, on the rise
Super commuters are more likely to rely on public transportation than those with shorter commutes.
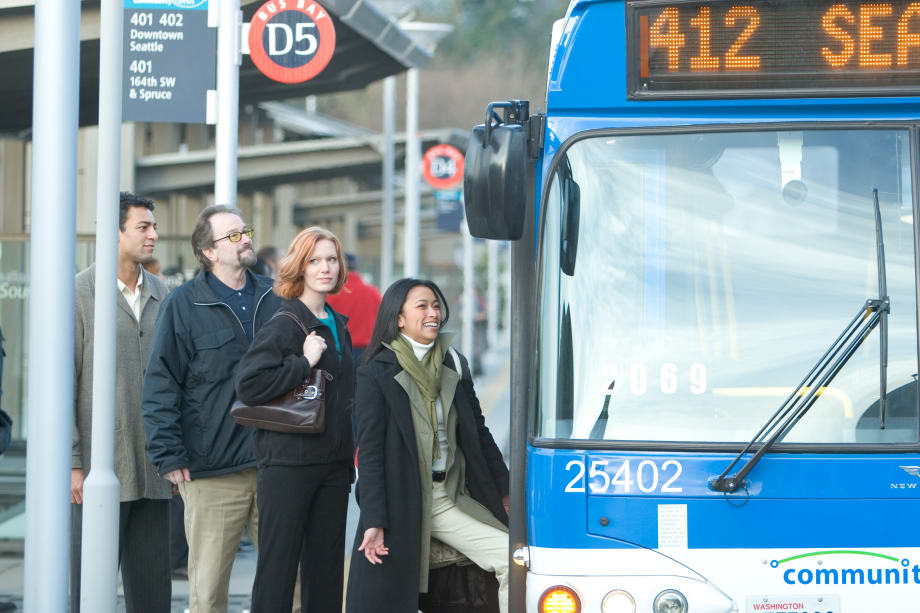
Nationwide, one in 36 commuters are super commuters, traveling 90+ minutes to work each day. Photo: Community Transit
Every morning, in Stockton, Calif., Sheila James, a Department of Health and Human Services employee, rises from bed to travel three hours on two trains and a bus to reach her job in San Francisco. Across the country, in Oxford, Conn., Corey Ferrell, an electrical engineer, travels three-and-a-half hours each way to work, relying on a bicycle, two trains and a walk to reach his job in Manhattan. Finally, in Miami, housekeeper Odelie Paret’s 13.5-mile commute can take anywhere from one to three hours each way, as she relies on two buses with often unpredictable schedules to get to work.
James, Ferrell and Paret are just a few of the nearly 4 million American workers who travel 90 minutes or more each day to work. These workers comprise a special class of commuters known as super commuters. A new Apartment List analysis of Census data shows that the ranks of super commuters swelled from 2005 to 2016 in metros across the nation. City planners, transportation experts and housing industry officials would be well-advised to consider this class of commuters as they plan for the future.
While super commuters still represent a small share of the overall workforce, their long commutes have become increasingly common over the past decade. In 2005, there were about 3.1 million super commuters, roughly 2.4 percent of all commuters. By 2016, that share had increased by 15.9 percent to 2.8 percent of all commuters, or about 4 million workers. In some parts of the country the problem is much worse; in Stockton, where James lives, 10 percent of commuters travel more than 90 minutes to work each day.
The rising number of super commuters underscores a general trend towards longer commutes. The share of commuters traveling 24 minutes or less to work each day has decreased to 55 percent of all commuters in 2016 from 59 percent in 2005. Meanwhile, the share of commuters traveling 25 minutes or more has increased to 45 percent in 2016, compared to 41 percent in 2005. The share of commuters traveling an hour or more to work each day increased 16.1 percent to 9.2 percent in 2016 from 7.9 percent in 2005.
The increase in super commuters isn’t just seen in the regions surrounding expensive cities such as San Francisco, Miami and New York. The share of super commuters increased in 39 states and nearly three-quarters of the nation’s largest metros between 2005 and 2016. Experts attribute the rise in long commutes to “skyrocketing housing costs and a reluctance to move, born of memories of the 2008 financial crisis.” Additionally, new housing is skewed towards the periphery of major cities, rather than urban cores and inner suburbs, forcing many workers to take on longer commutes in exchange for lower home prices.
Large Metros with Strong Economies -- and Metros on Their Periphery -- Have the Largest Share of Super Commuters
Top 10 Metros with the Highest Share of Super Commuters
Rank | Metro | Share | Number |
1 | Stockton, Calif. | 10.0% | 28,441 |
2 | Modesto, Calif. | 7.3% | 15,335 |
3 | Riverside, Calif. | 7.3% | 127,156 |
4 | New York | 6.7% | 616,789 |
5 | Bridgeport, Conn. | 6.1% | 27,082 |
6 | San Francisco | 4.8% | 104,480 |
7 | Washington, D.C. | 4.6% | 138,290 |
8 | Allentown, Pa. | 4.1% | 15,756 |
9 | Atlanta | 3.9% | 101,796 |
10 | Los Angeles | 3.8% | 227,009 |
The metros with the largest share of super commuters are a mix of large metros with strong economies and bad traffic — New York, San Francisco, Washington, D.C., Atlanta and Los Angeles — and their surrounding areas.
Increasingly, the most lucrative jobs and most talented, wealthy people are converging in a few “superstar cities” that are are knowledge and technology hubs. Eight of the 10 metros with the largest share of super commuters are in regions surrounding three superstar cities: San Francisco, Los Angeles and New York. These same three cities contain 80 percent of the zip codes where the median home price was $1 million or more. Two other thriving cities — Atlanta and Washington, D.C. — also see large shares of super commuters, and workers throughout the metro are drawn to job opportunities in city centers. While many higher-paid, highly-educated workers can afford to live in superstar cities, other workers are priced out due to high demand and restrictive zoning regulations that lead to a lack of new housing. These workers are forced to move further from work, enduring longer commutes.
Of the ten cities with the most super commuters, eight of them fall into three regions close to the superstar cities of San Francisco, Los Angeles and New York City:
On the outskirts of the San Francisco Bay area, Stockton and Modesto, have the largest share of super commuters, with 10 percent and 7.3 percent of the workforce super commuting, respectively.
This pattern isn’t unique to the Bay Area. In Riverside, Calif., super commuters battle hours in traffic to reach Los Angeles.
Across the country in Bridgeport, Conn., super commuters are making the daily trek to New York City. And Allentown, Penn., super commuters are likely heading to New York City or Philadelphia.
At the state level, New York (5.5 percent) and New Jersey (5.1 percent) have the highest share of super commuters, as workers throughout the region are drawn to the lucrative job opportunities in New York City, but priced out of nearby housing markets.
Super Commuters are Much More Likely to Rely on Public TransportationShare of Commuters Who Drive to Work
| |||||||||||||||||||||||||||||||||||||||||||||||
Rank | Regular Commuters | Super Commuters | Difference | ||||||||||||||||||||||||||||||||||||||||||||
|---|---|---|---|---|---|---|---|---|---|---|---|---|---|---|---|---|---|---|---|---|---|---|---|---|---|---|---|---|---|---|---|---|---|---|---|---|---|---|---|---|---|---|---|---|---|---|---|
1 | 95.40% | 47.90% | 47.50% | ||||||||||||||||||||||||||||||||||||||||||||
2 | 93.80% | 58.30% | 35.50% | ||||||||||||||||||||||||||||||||||||||||||||
3 | 92.40% | 59.60% | 32.80% | ||||||||||||||||||||||||||||||||||||||||||||
4 | 91.00% | 58.70% | 32.30% | ||||||||||||||||||||||||||||||||||||||||||||
5 | 61.40% | 31.50% | 29.90% | ||||||||||||||||||||||||||||||||||||||||||||
6 | 91.80% | 62.40% | 29.40% | ||||||||||||||||||||||||||||||||||||||||||||
7 | 95.80% | 68.30% | 27.40% | ||||||||||||||||||||||||||||||||||||||||||||
8 | 83.50% | 57.20% | 26.30% | ||||||||||||||||||||||||||||||||||||||||||||
9 | 86.30% | 61.40% | 24.90% | ||||||||||||||||||||||||||||||||||||||||||||
10 | 93.70% | 70.20% | 23.50% |
Nationwide, 91.4 percent of commuters who travel under 90 minutes commute via private vehicle, compared to 69.7 percent of super commuters. While part of this gap is due to the fact that a larger share of super commuters are in metros such as New York and San Francisco with more robust public transportation, the trend holds true within metros as well. Compared to those with shorter commutes, a larger share of super commuters travel to work without a private vehicle in 49 of the 50 largest U.S. metros.
The lack of reliable and efficient public transportation is likely driving lengthy commute times for transit users in metros such as Las Vegas, Cleveland and Salt Lake City, even for some workers who aren’t traveling very far. Almost all commuters in these metros rely on driving, whereas super commuters are much more likely to rely on public transportation than those with shorter commutes. For example, in Las Vegas 95.4 percent of non super-commuters drive to work, compared to just 47.9 percent of super commuters. Even in metros with more robust public transportation, such as New York, San Francisco and Boston, super commuters are more dependent on transit than those with shorter commutes.

The graph above shows the share of commuters above and below their metro median income who rely on public transportation to get to work. Low-income commuters disproportionately rely on public transportation compared to their higher income peers, irrespective of their commute length. For example, in Cleveland, Ohio, 55.5 percent of super commuters earning below the median income rely on public transportation, compared to 16.6 percent of super commuters above the median income. For regular commuters, 5.2 percent of those below the median income use public transportation, compared to 1.8 percent of those above the median income. In Cleveland— and other metros without robust transportation — it’s likely that with a car, or more efficient public transportation, super commuters in these metros would experience shorter commutes.
According to urban planning scholar Daniel Chatman, more people living and working in a city center boosts both wages and productivity, but many thriving cities have built too little housing to keep up with job growth. Efficient public transportation plays a key role in achieving these wage and productivity gains because it allows more workers to access job centers.
In metros such as Las Vegas, Cleveland and San Antonio, public transportation improvements would ease the time burden on lower-income commuters. These commuters often rely on slow and unreliable transportation not by choice but out of necessity. A 2015 Harvard study found that “commuting time emerged as the single strongest factor in the odds of escaping poverty.” Investing in public transportation will not only relieve some of the burden on low-income super commuters, but will lead to more residents using transportation by choice instead of financial desperation.
The fact that transit usage is lower for higher-income commuters suggests that transit is often used out of necessity rather than choice in some metros. In metros with more robust inter- and intra-metro public transit, such as the San Francisco Bay Area and Washington, D.C., a greater share of higher income commuters use public transit. In these locations, more commuters are likely choosing to use public transportation for reasons besides being unable to afford a car.
Conclusion
While super commuters still represent a small share of overall commuters, long commutes are growing more common. From 2005 to 2016, the share of super commuters increased 15.9 percent from 2.4 percent to 2.8 percent. As more households are priced out of expensive cities and inner suburbs, without major investment in public transit, the growth in the share of super commuters is likely to continue.
Increasing the share of residents using public transportation -- by improving existing transit, building new transportation infrastructure and building housing near transit -- will have positive environmental impacts, as transit produces lower greenhouse gas emissions than commuting via private vehicle.
Additionally, as demand from higher-income households increases housing prices in cities, neighborhoods become unaffordable to lower-income households who live in these areas in the past. For these displaced residents, improved transit provides easier access to job centers and offers improved social mobility. Reversing the growth in super commuting requires investment in both increasing housing supply and improving transportation.
To view the full report, click here.
This story was originally published (in its entirety) on Apartmentlist.com.
More Management

CTDOT Taps STV for Electric Bus Facility Design
The firm will work with CTDOT and RVT to define the facility layout, operational requirements, and long-term flexibility for RVT’s growing electric fleet.
Read More →
USDOT Awards $170M for Transit Projects in Latest BUILD Grants
Federal funding will support maintenance facility upgrades and other projects aimed at improving transit safety and reliability across the U.S.
Read More →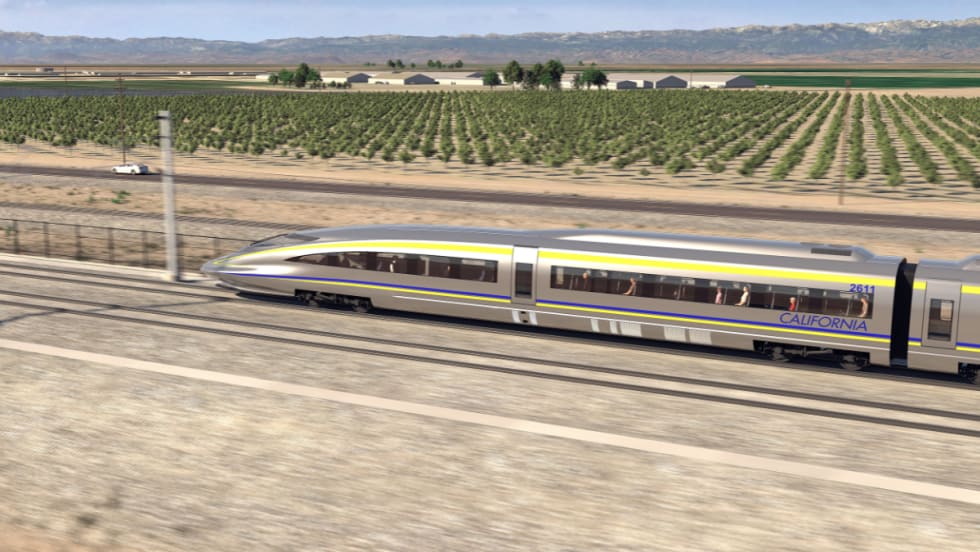
Keolis and SNCF Voyageurs Bring Rail Expertise to California High-Speed Rail
The CDA establishes a collaborative predevelopment partnership intended to evaluate future delivery opportunities through public-private partnership models.
Read More →
Ford to Leave JTA After More Than 10 Years as CEO
He plans to continue his work advancing innovative mobility solutions to improve the quality of life in communities across the nation. He did not announce specific plans.
Read More →
Stadler Marks 10 Years in the U.S. with Salt Lake City Expansion
The expansion is expected to create up to 300 new local jobs, some of which are youth apprenticeships, said Stadler officials.
Read More →
Hitachi Rail Completes Acquisition of Intelligent Transportation Systems Provider Clever Devices
The acquisition expands Hitachi Rail's North American presence and multimodal capabilities, combining rail and bus technologies to deliver more integrated digital solutions for transit agencies.
Read More →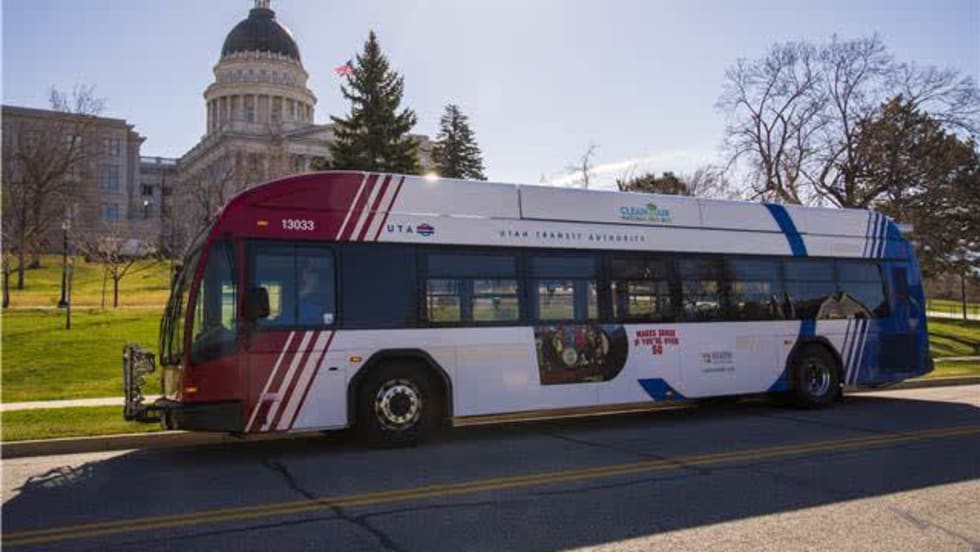
Utah Transit Authority Adopts New Governance Model
State leaders said the changes will improve oversight, coordinate transportation investments, and support expanding transit service across the Wasatch Front.
Read More →
Federal Highway Administration Seeks Public Input on Future of Interstate System
The initiative invites feedback on new routes, major upgrades, and emerging transportation needs, including issues that could affect public transit and motorcoach operations.
Read More →
New York MTA to Replace Three East End LIRR Bridges
Each structure, built between 1895 and 1921, serves vehicular traffic over the LIRR’s Montauk Branch.
Read More →
Transit Pilot Offers Lessons for Expanding Mobility Access
An Urban Institute evaluation found that a fare-free transit program increased ridership, reduced transportation barriers, and improved access to jobs, healthcare, and other essential services.
Read More →