
Dig Deeper: The Best (& Worst) Cities for Commuting
Top 100 Bus Fleets Survey: Transit Works to Boost Ridership, Services
To better serve customers, agencies are revamping services and offering more mobility options, including bike-share, ride-share, microtransit, and more.
by Alex Roman, Managing Editor
September 17, 2019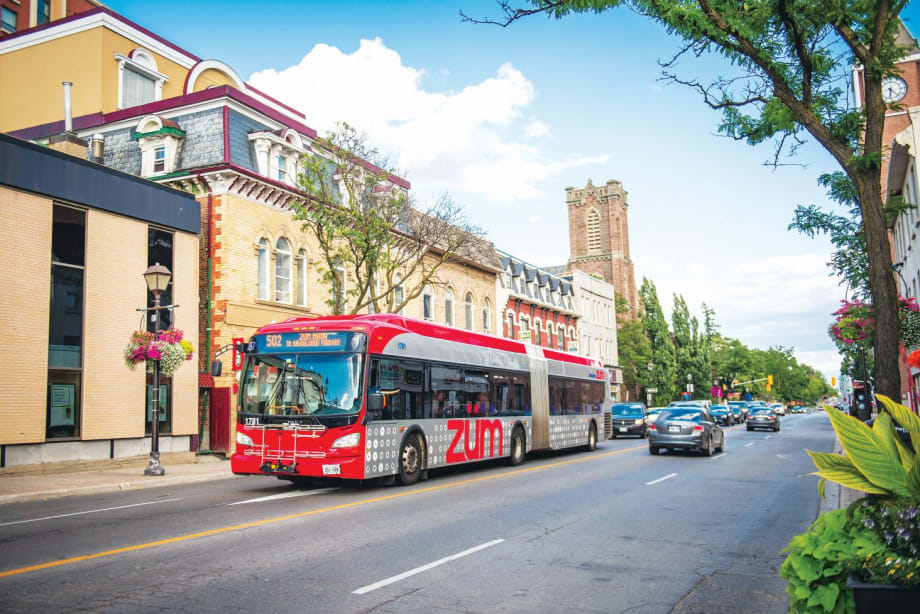
With a total of 438 vehicles, Ontario, Canada's Brampton Transit comes in at No. 48 in this year's Top 100.
Photo: Christina DeMelo_Brampton Transit
6 min to read
With 40% of public transit agencies experiencing issues with boosting ridership, many are taking a more multimodal approach, according to respondents to METRO’s 2019 Top 100 Bus Fleets survey.
To deal with those ridership issues, agencies including San Antonio’s VIA Metropolitan Transit (No. 35) and Austin, Texas’ Capital Metro (No. 40) are revamping services to increase frequencies in busy corridors, boosting or even creating services in new job centers or new housing developments, or decreasing services in areas where ridership is low.
In San Antonio, the introduction of new high-frequency services over the last year or so have resulted in 20% to 25% ridership increases, while revamping services in Austin resulted in ridership increases in 11 of the network’s first 12 months, culminating in a better than 11% increase between May 2018 and May 2019.
Another solution to help boost ridership are on-demand and microtransit services, which are being used in areas where ridership is low, to help solve the first-, last-mile issue, or to increase options for paratransit clientele.

In California, the Orange County Transportation Authority (No. 26) launched microtransit services in two zones as part of its OC Bus 360 program, which was designed to look for ways to address ridership decline and stabilize it or get it trending up.
The OC Flex microtransit service uses wheelchair-accessible shuttles, which are each capable of holding up to eight passengers, to provide on-demand service that takes passengers curb-to-curb within the two designated zones for $4.50 using the mobile app, or $5 cash on board. An OCTA pass gives customers unlimited daily rides in either of the zones and on any OC Bus fixed-route for the day.
The service also enables Metrolink and Amtrak commuter rail pass holders to use the service as a first-mile, last-mile option to and from train stations for free.
Other transit agencies that have explored microtransit services include the Sa cramento Regional Transit District (No. 89), the Central Ohio Transit Authority (No. 52), and Denver’s Regional Transportation District (No. 12).
To alleviate costs while also supplying better flexibility to paratransit customers, transit agencies are also partnering with transportation network companies (TNCs) to provide wheelchair-accessible on-demand transportation services.
In Boston, the Massachusetts Bay Transportation Authority (No. 20) has been partnering with Lyft and Uber since 2016, and this year launched a pilot program enabling paratransit customers who use wheelchairs and other devices to begin taking trips using the ride-hailing services.

As part of the one-year pilot program, Uber and Lyft receive a subsidy on a per-hour basis for every hour that wheelchair-accessible vehicles are available for use. The per-trip fee assessed through the 2016 Act Regulating TNCs are being used to reimburse participating TNCs in exchange for providing on-demand wheelchair-accessible vehicles within The RIDE paratransit service area. It was estimated the subsidy would cover approximately 50% of actual WAV supply cost with TNCs contributing the remainder.
Other ways transit agencies are trying to help boost ridership and mobility, include launching bike-share, scooter, ride-share, and car-share programs; piloting autonomous vehicles; and offering low-income fare programs.
To view this year's Top 100 list, click here.
Challenges and tech
In addition to ridership issues, 67% of transit agencies are reporting they are having issues attracting talent, particularly bus operators and maintenance staff.
Some transit agencies report they are tackling the challenge by focusing on retention, including taking measures to improve quality of life and work-life balance for its employees. Other measures include offering sign-on, referral, and/or retention bonuses at certain employment milestones in their efforts to maintain high-quality staff. Additional retention-focused measures include providing better training, instituting internal workforce development programs, and improving the on-boarding process.
To actually attract talent, a few agencies are employing HR staff devoted to recruiting, while an overwhelming amount of agencies report they have increased their advertising and marketing for available positions. However, the types of outreach vary and include everything from attending career fairs and hosting open houses to recruiting via social media and through partnerships with local colleges and vocational schools.
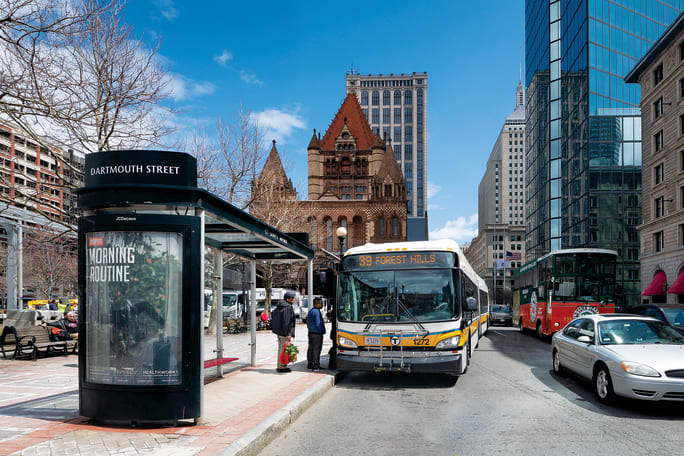
Agencies continue to revamp services to better serve ridership.
Photo: MBTA
Transit agencies have also taken to advertising on its vehicles and at bus stops and bus shelters for the first time, as well as posting job openings across numerous websites and in multiple cities.

Outside of optimizing its bus services and focusing on a more multimodal mobility solution, transit agencies are also adding new technologies to enhance the rider experience and to increase efficiencies.
On that note, the implementation of CAD/AVL systems continues to grow across the industry, as transit agencies focus on providing improved real-time bus arrival information via its apps and websites.
With that, transit agencies including Louisville, Ky.’s Transit Authority of River City (No. 87) are building more efficient mobile apps that help riders plan their commutes with the potential to use multiple modes of transportation, as well as pay for their entire commute via one app.
TARC partnered with ZED Digital to launch the app in May, which enables customers to seamlessly plan trips across multiple modes of travel, including TARC, Uber, Lyft, Bird Scooters, and LouVelo Bike Share. The next phase of the platform includes real-time parking availability and an added integrated payment solution allowing customers to pay for their full trip, across all platforms from within the TARC app.
Other popular technologies being implemented by transit agencies, include upgrades to radio, scheduling, and transit management systems; increased implementation of surveillance cameras; and improved signage at bus stops and shelters. To enhance safety, a few agencies reported the installation of pedestrian warning/collision avoidance systems and the implementation of driver safety shields to better protect bus operators.
Looking at the Bus Numbers
The Metropolitan Transportation Authority’s (MTA) New York City Transit/MTA Bus Co. tops this year’s list with 5,825 total vehicles. The rest of this year’s top five remains status quo compared to last year, with New Jersey Transit (3,003), L.A. Metro (2,320), Chicago’s Pace Suburban Bus (2,129), and Coast Mountain Bus Co. (1,943) all maintaining their positions. Collectively, the top five totals 15,220 vehicles, or 22% of this year’s overall 69,281 vehicles.
With 416 total vehicles, West Palm Beach, Fla.’s Palm Tran lands right in the center of the list at No. 50, while Oceanside, Calif.’s North County Transit District rounds out the Top 100 with 182 total vehicles.
A closer look at the numbers reveals 48,614 buses are 35 feet or longer, making up 71% of the total vehicles reported, with 13,344, or 19%, of vehicles 35 feet and under.
Overall, this year’s respondents report that they intend to, or have on order about 4,000 vehicles in the next year. A good number of those planned purchases include electric buses, though still on a somewhat smaller scale. When asked who those new purchases will be with, New Flyer, Gillig, BYD, and Proterra were the suppliers most mentioned.
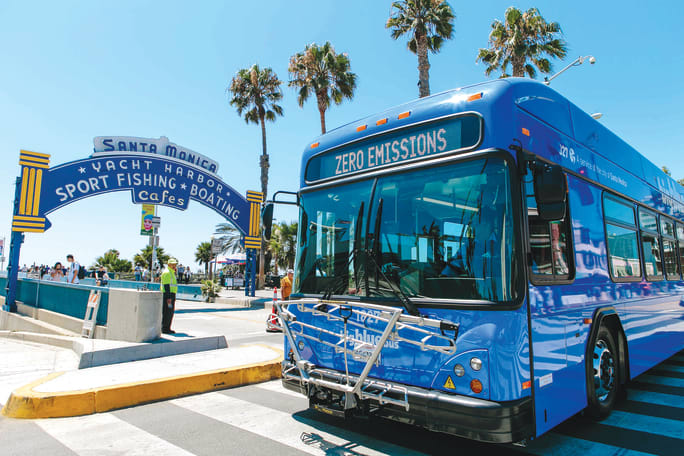
The usage of battery-electric buses continues to grow, particularly in California where agencies like BBB have set aggressive zero-emission goals.
Photo: Big Blue Bus
Subscribe to Our Newsletter
More Bus
June LA Metro Ridership Surges 2 Million Year Over Year
Total June ridership increased for both weekdays and weekends. Weekday ridership was 953,820, which grew 8.4% from June 2025; Saturdays increased nearly 13% year-over-year to 708,826; and Sundays increased 7.7% to 611,534 from June 2025, according to LA Metro.
Read More →
Washington's Pierce Transit Board Sends Transit Funding Measure to November Ballot
With the adoption of Resolution 2026-006, the measure moves to the Pierce County Auditor, giving voters in the Pierce Transit service area the decision on whether to fund an expansion of local transit service within the agency’s service area.
Read More →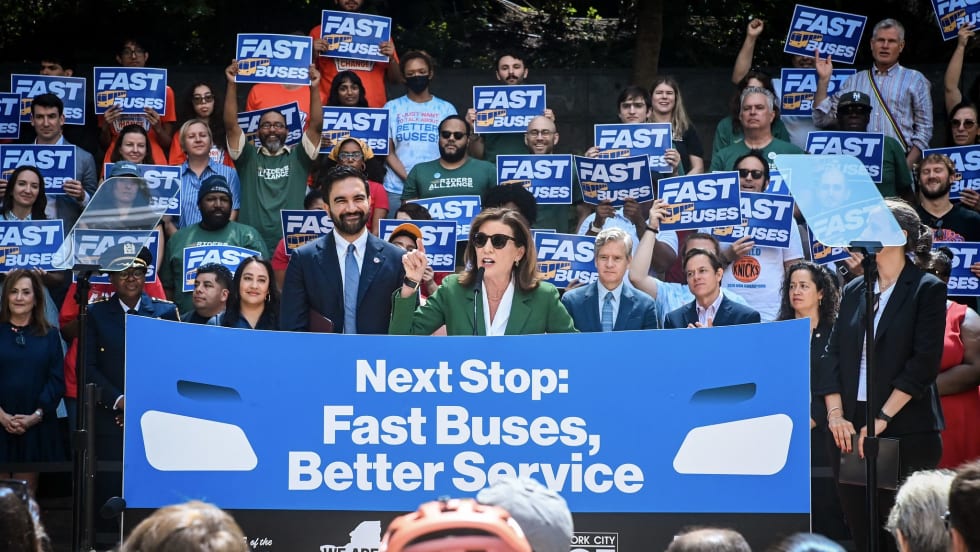
New York Unveils Sweeping Plan to Modernize City Bus Service
Next Stop: Fast Buses, Better Service identifies 50 priority bus corridors for improvements across the five boroughs and launches the City’s next generation of rapid bus service along five key routes.
Read More →
CTDOT Taps STV for Electric Bus Facility Design
The firm will work with CTDOT and RVT to define the facility layout, operational requirements, and long-term flexibility for RVT’s growing electric fleet.
Read More →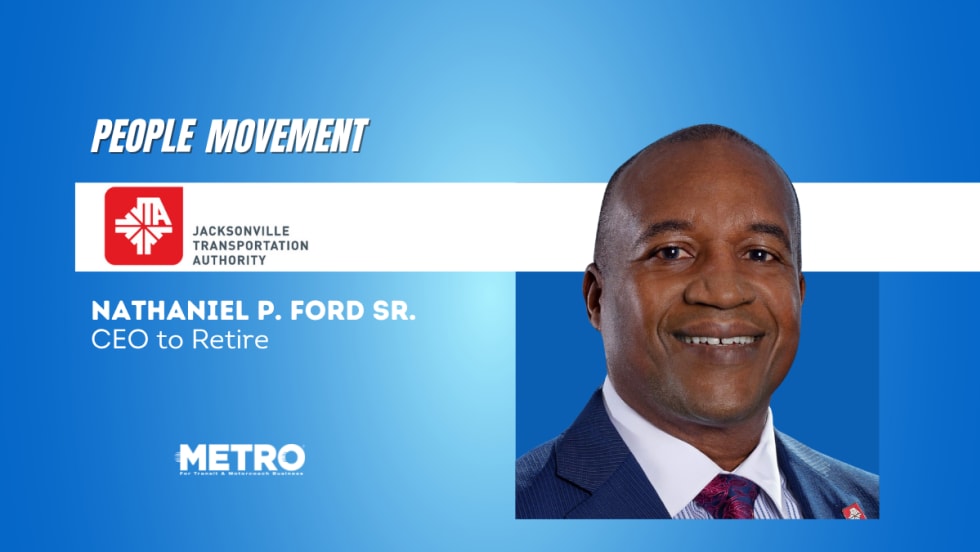
Ford to Leave JTA After More Than 10 Years as CEO
He plans to continue his work advancing innovative mobility solutions to improve the quality of life in communities across the nation. He did not announce specific plans.
Read More →
Transit Leaders Push for Bus Procurement Reforms to Reduce Costs
Industry experts said reducing unnecessary bus customization and modernizing purchasing practices could help transit agencies buy more vehicles, improve reliability, and make better use of limited funding.
Read More →
Executive Order Aims to Improve Transit Access Across California
The order directs state agencies to streamline transit project delivery, improve coordination, and expand access to bus and passenger rail services across California.
Read More →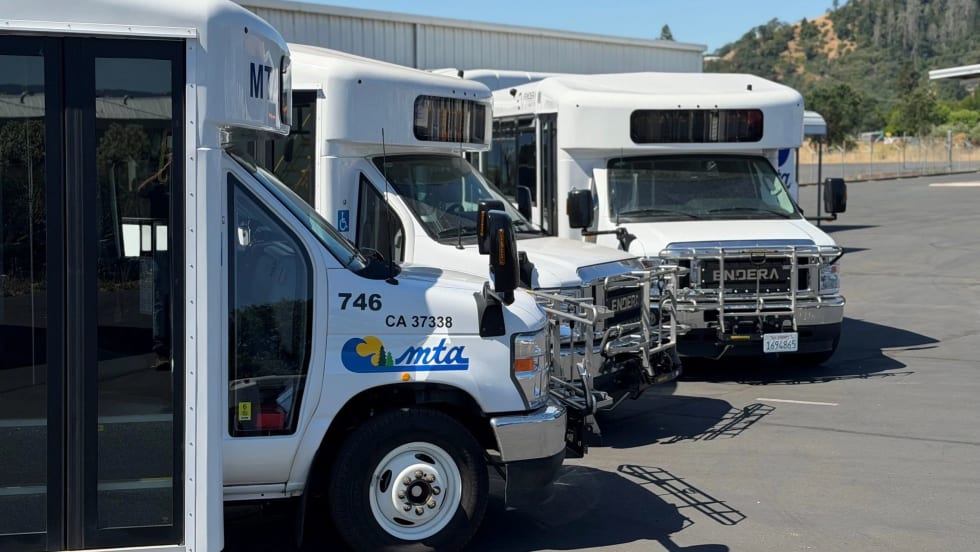
Biz Briefs: Endera Delivers to California, Safety Vision Teams with San Antonio's VIA, and More
From manufacturers and suppliers to transit agencies and motorcoach operators, these updates offer a snapshot of the projects, partnerships and business moves driving the industry forward.
Read More →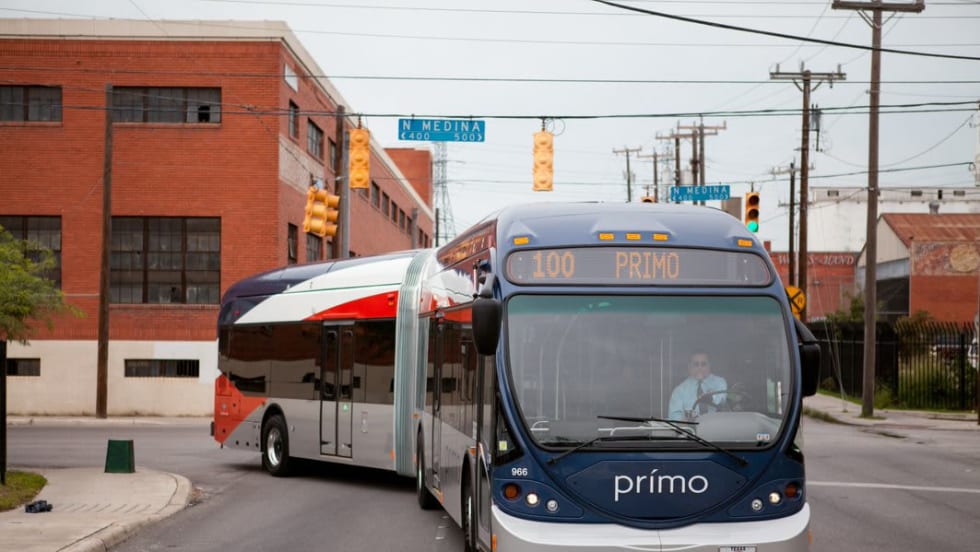
VIA's Silver Line Clears Environmental Review, Advances Toward Construction
The VIA Rapid Green Line is currently under construction, with service expected to begin in April 2028.
Read More →
Modernizing Mobility with CharterUP CEO Armir Harris
From digital transformation to evolving customer demands, CharterUP's Armir Harris offers his perspective on the transportation industry's next chapter.
Read More →