TNCs caused increased congestion across all times of day, including the morning peak, mid-day, and evening peak, but the increase attributable to TNCs was most pronounced in the evening.
The San Francisco County Transportation Authority released “TNCs & Congestion,” a report providing the first comprehensive analysis of how Transportation Network Companies (TNCs) Uber and Lyft collectively have affected roadway congestion in San Francisco.
The report found that TNCs accounted for approximately 50% of the rise in congestion in San Francisco between 2010 and 2016, as indicated by three congestion measures: vehicle hours-of-delay, vehicle-miles traveled, and average speeds. Employment and population growth were primarily responsible for the remainder of the worsening congestion. As a share of total congestion citywide, TNCs account for an estimated 25%.
Ad Loading...
The TNCs and Congestion report follows the agency’s 2017 “TNCs Today” report that quantified the number and distribution of local TNC trips in San Francisco.
Major findings show that collectively the ride-hail services accounted for:
Fifty-one percent of the increase in daily vehicle hours of delay between 2010 and 2016.
Forty-seven percent of the increase in vehicle miles traveled during that same time period.
Fifty-five percent of the average speed decline on roadways during that same time period.
On an absolute basis, TNCs comprise an estimated 25% of total vehicle congestion (as measured by vehicle hours of delay) citywide and 36% of delay in the downtown core.
Notably, the report indicates that TNC activity affects congestion differently throughout the day and throughout the city. TNCs caused increased congestion across all times of day, including the morning peak, mid-day, and evening peak, but the increase attributable to TNCs was most pronounced in the evening.
Consistent with prior findings from the Transportation Authority’s 2017 TNCs Today report, TNCs also caused the greatest increases in congestion in the densest parts of the city — up to 73% in the downtown financial district — and along many of the city’s busiest corridors. TNCs had little impact on congestion in the western and southern San Francisco neighborhoods.
Ad Loading...
The report also found that changes to street configuration, such as when a traffic lane is converted to a bus-only lane, contributed less than 5% to congestion.
“This report further quantifies the impact ride-hail services have on our streets,” said Aaron Peskin, chair of the San Francisco County Transportation Authority (SFCTA) and District 3 Supervisor. “It underscores the importance of our current collaboration with Transportation Network Companies to develop a per-trip tax to help mitigate the impacts of these trips, and informs our efforts to balance the availability of these new mobility options with our Transit First policies.”
How is congestion measured?
The TNCs and Congestion report uses the following common measures of roadway congestion:
Vehicle Hours-of-Delay: Measuring the overall amount of excess time spent in congestion, it is the difference between congested travel times and free flow travel times on a given roadway segment.
Vehicle-Miles Traveled: A measure of the overall amount of travel, as measured in distance, that occurs on the streets.
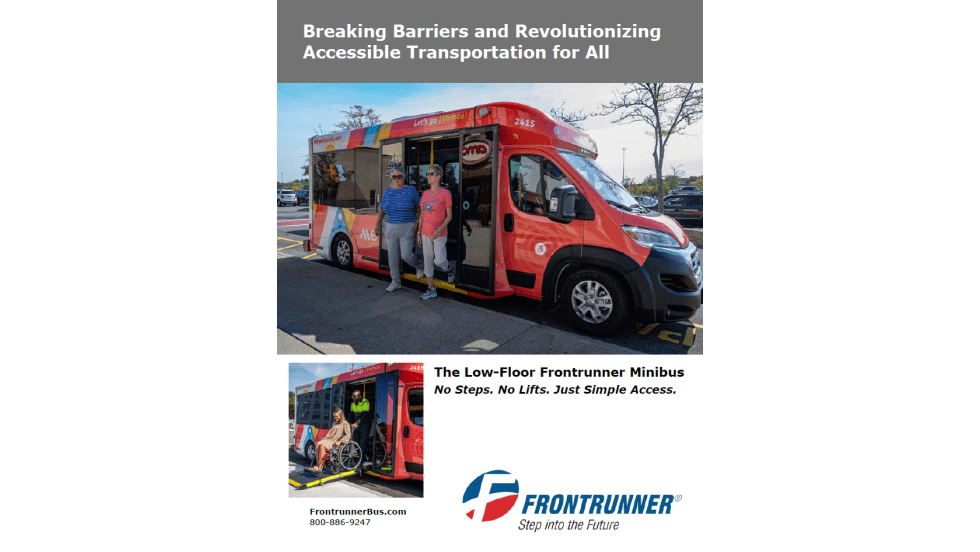
Accessible transit isn’t a feature—it’s a responsibility. This whitepaper explores how the Low-Floor Frontrunner is redefining mobility with a breakthrough design that removes barriers, empowers riders, and delivers measurable operational advantages for agencies. Discover why this next generation minibus is setting a new standard for inclusive transportation.
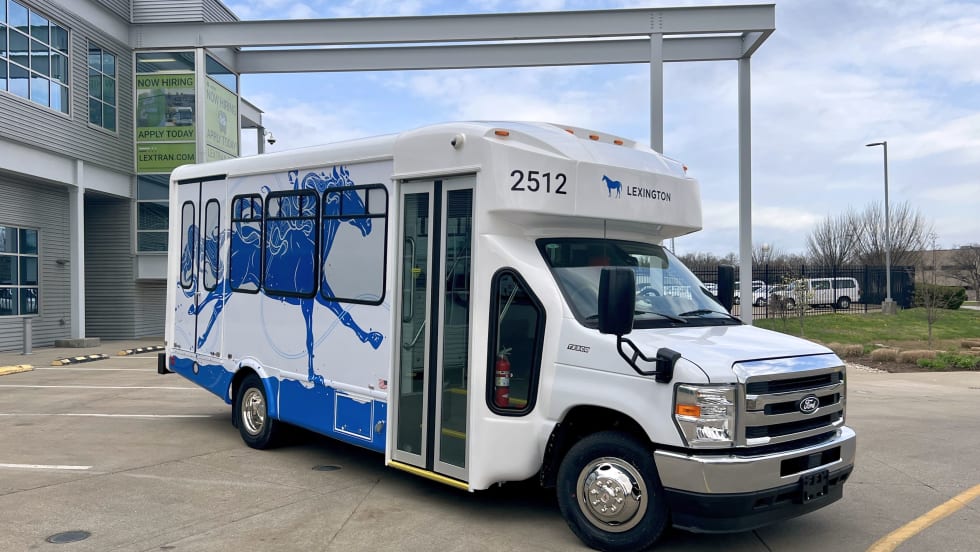
LexRide connects key destinations, including Downtown Lexington, the Distillery District, and the Warehouse Block/National Avenue area, making it easier to explore without worrying about parking, traffic, or multiple rideshare trips.
Sustainability Partners’ Arnold Albiar discusses how a service-based approach is helping airports and public agencies deploy and manage electric fleets more efficiently.
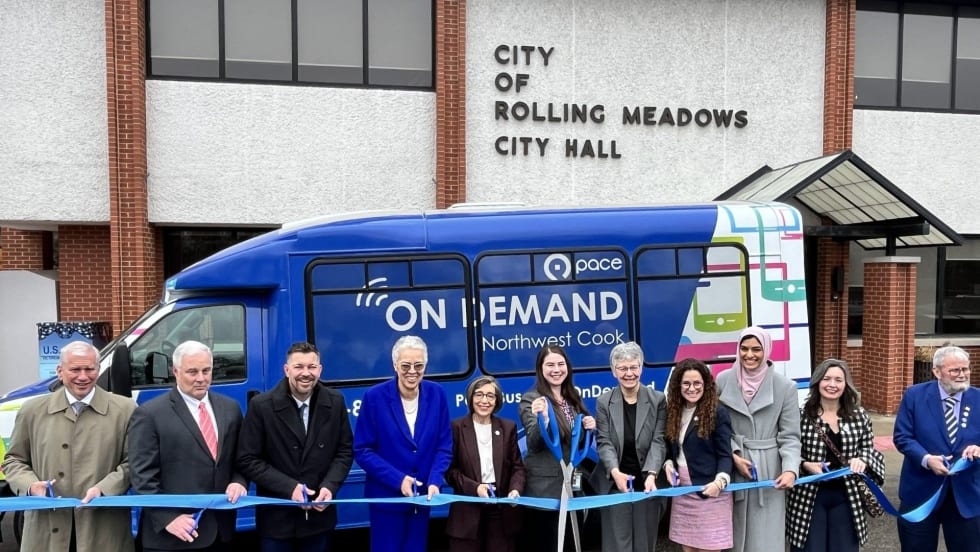
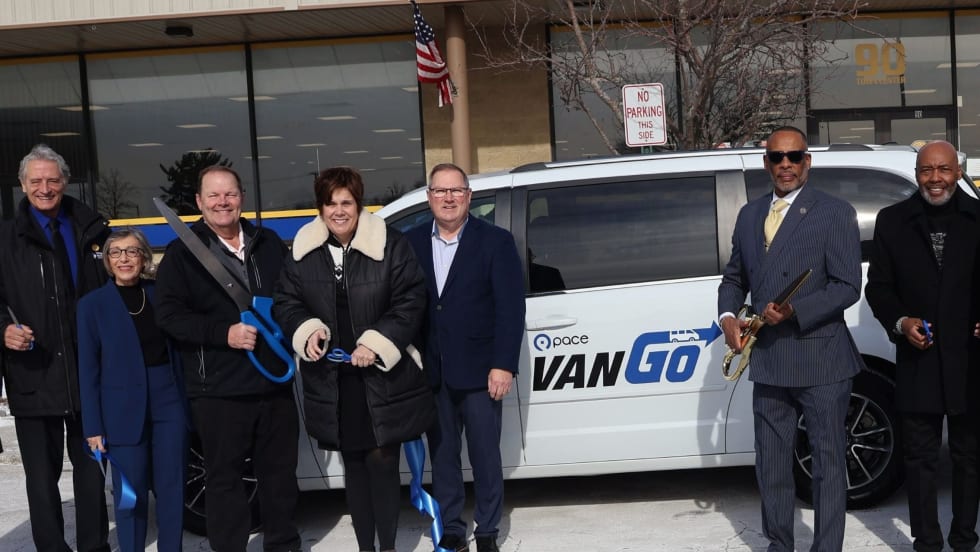
The expanded service builds on Pace’s growing On Demand network and is intended to improve access to destinations such as medical appointments, schools, shopping, employment centers and connections to the regional transit system.
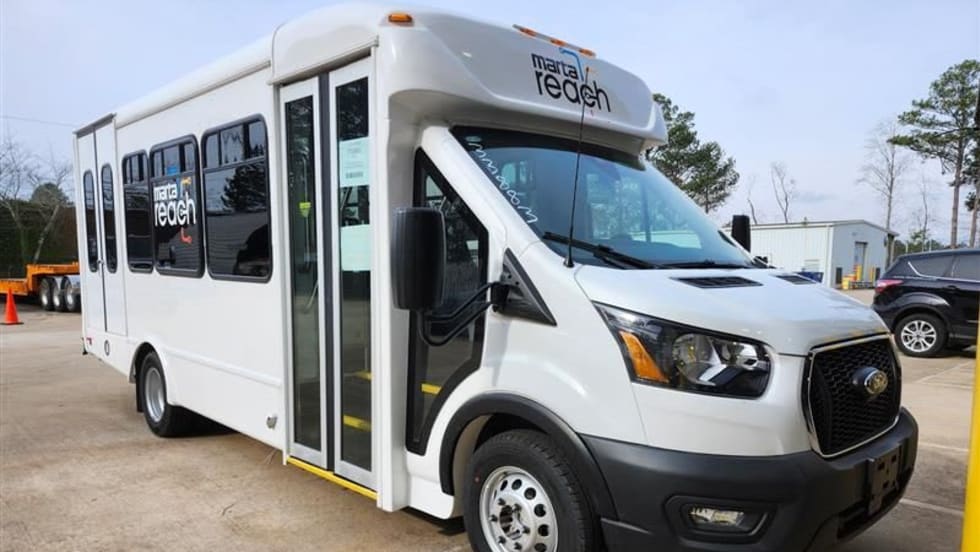
An important part of the authority’s NextGen Bus Network, MARTA Reach will bring transit service directly to the rider’s location and offer a seamless link to the broader rail and bus system.
In this edition, we cover recent appointments and announcements at HDR, NCTD, STV, and more, showcasing the individuals helping to shape the future of transportation.
The service is a flexible, reservation-based transit service designed to close the first- and last-mile gaps and connect riders to employment for just $5 per day.