



RELATED: 62% of U.S. workers didn't apply for job due to commute
Mobility report finds L.A., Miami travelers have longest commute times
People in almost every city said top reason that would get them to use public transit more often is accurate and reliable arrival times.
January 16, 2020
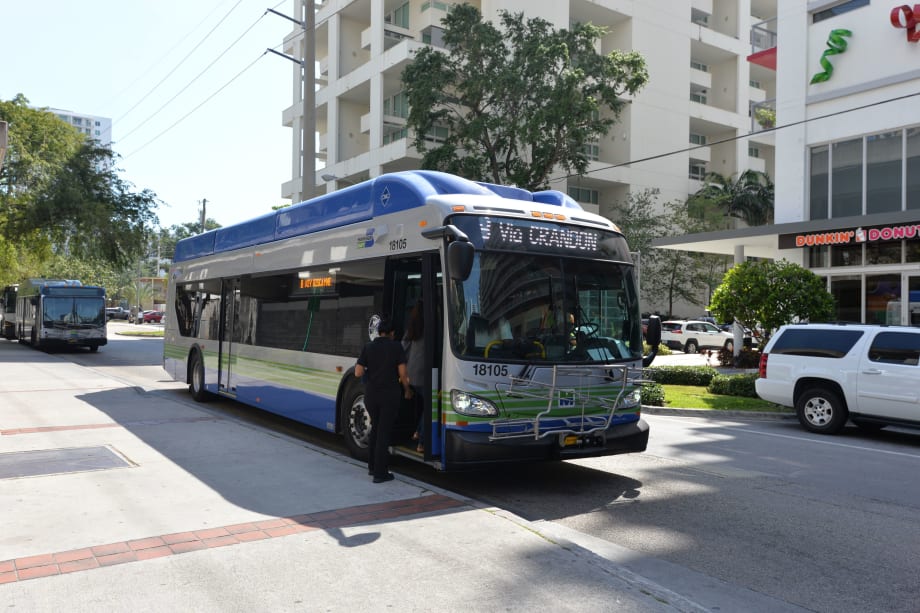
Pittsburgh commuters have the shortest public transit commute duration, while Los Angeles and Miami (shown) travelers tie for the longest commute time.
Miami-Dade County
7 min to read
Pittsburgh commuters have the shortest public transit commute duration, while Los Angeles and Miami (shown) travelers tie for the longest commute time.
Miami-Dade County
Pittsburgh commuters have the shortest public transit commute duration, while Los Angeles and Miami travelers tie for the longest commute time, according to a new report from Mobility as a Service solutions company, Moovit.
Big data analysis from millions of trip requests performed in 99 cities across the Americas, Asia, and Europe in 2019, combined with user research, reveals valuable insights about the way people get around cities.
Fast facts about public transit in the U.S.:
1. Pittsburgh commuters have the shortest public transit commute duration, while Los Angeles and Miami travelers tie for the longest commute time
2. Miami, by far, has the longest average walking distance during a commute, while those in the NYC-NJ metro area have the shortest distance
3. In Pittsburgh, 57% don’t need to transfer and can get where they’re going using one line
4. Commuters in almost every city said accurate and reliable arrival times would encourage them to use public transit more often
5. Most Americans — 63% — have never used micro-mobility, although the option exists in their cities
THE DATA IN MORE DEPTH:
Total commute time during single trip:
Pittsburgh travelers have the shortest commute, with an average of 38 minutes per trip
~ Seattle-Tacoma-Bellevue metro area comes in second, with 48 minutes
~ Boston rounds out the top three metro areas with the shortest commute, with 50 minutes
Los Angeles and Miami travelers tie in first place for the longest commutes in North America with an average of 56 minutes for a single trip
~ Miami also has the largest percentage of people in the U.S. commuting more than 2 hours per trip at 12%
~ NYC-NJ’s metro area has the second longest commutes on average in the U.S. with 54 minutes per trip
~ NYC-NJ also has the largest percentage of travelers — 27% — commuting between 1-2 hours per trip
Total wait time at stops/stations per trip:
Boston and Pittsburgh commuters have the shortest average wait time at their stops/stations for their transit per trip, just 11 minutes
~ Washington, DC-Baltimore has the highest percentage of commuters with the shortest wait time - 27% wait less than 5 minutes per trip
~ Boston is right behind with 26% waiting less than 5 minutes per trip
~ NYC-NJ metro area takes third place in the U.S. for commuters waiting less than 5 minutes every trip with 23%
Miami and Los Angeles tie for the longest average wait times, with an average of 16 minutes per trip
~ Miami also has the highest percentage of travelers, 28%, waiting more than 20 minutes for their transit - the worst in North America
~ Los Angeles is right behind, with 27% of commuters waiting more than 20 minutes
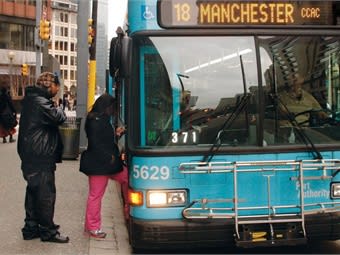
Pittsburgh travelers have the shortest commute, with an average of 38 minutes per trip.
Port Authority of Allegheny County
Total average walking distance per trip:
In Miami, the average distance walked during a commute, from start to end, including during transfers, is 0.8 miles, by far the longest in North America
~ Both Seattle-Tacoma-Bellevue metro area and Boston tie for second place, with an average walking distance walked at 0.6 miles per trip
New Yorkers and New Jerseyan’s walk the least on average per trip - under half a mile (0.49), the shortest in North America
~ Twenty-five percent of NYC-NJ commuters walk more than 0.6 miles during a trip
Number of vehicle transfers per trip:
Miami has the biggest percentage of travelers (30%) needing three or more transfers, the worst in North America
~ About 1 in 4 travelers in the Chicago, Los Angeles, Seattle, and Washington,DC-Baltimore metro areas make three or more transfers with 28%, 25%, and 23%, respectively
Across all U.S. cities, 37%-45% of travelers make two transfers each trip
In Pittsburgh, 57% don’t need to transfer and can get where they’re going using one line
~ The Bay Area comes in second with 43% not needing to transfer
Total trip distance:
Miamians have the longest distance to travel with an average trip of 8.47 miles
~ Thirty-eight percent of commuters in both Miami and the Seattle-Tacoma-Bellevue area travel more than 7.5 miles each trip
~ Chicago comes in second for longest distance, with 31% traveling more than 7.5 miles per trip
Pittsburgh commuters have on average the shortest commute, with 4.44 miles per trip
~ Pittsburgh also has the smallest percentage of commuters (15%) traveling more than 7.5 miles
~ Boston is right behind, with 16% traveling more than 7.5 miles
Compared to other global cities:
When compared to all other cities, Los Angeles and Miami make the top 20 for longest average commute times, 16 and 18th place, respectively
~ Both cities have an average commute time of 56 minutes, compared to other large metro area, London, United Kingdom, with an average commute taking 45 minutes
When compared to every metro area in the world with a population over 1 million, Miami comes in first place for longest average walking distance per trip
Miami and Seattle take 8th and 9th place for longest average trip distance in the world
Ten percent of Los Angeles commuters average two hours, compared to 1% of commuters in Madrid, Spain
Los Angeles and Rio de Janeiro, Brazil both have 32% of local commuters walking more than 0.6 miles per commute
Twenty-five percent of commuters in NYC-NJ experience long walking distances of over 0.6 miles per trip, which is almost similar to European city, Paris, with 26% of commuters
Reasons to use public transit:
People in almost every city — NYC-NJ, Los Angeles, Washington,DC- Baltimore, Chicago, Seattle, Boston, and Pittsburgh — said the top reason that would get them to use public transit more often is accurate and reliable arrival times according to the published schedule
~ The second top incentive is higher frequency of public transit vehicles/shorter waiting times at stations, as mentioned by those in the SF Bay Area, Seattle-Tacoma-Bellevue metro area, and Miami
Although 23% in the NYC-NJ metro area wait less than 5 minutes in total during a commute, increasing the frequency of public transit vehicles/shorter waiting times at stations was the second-highest incentive
While 36% of Chicagoan commuters feel that personal safety will encourage them to use more public transit, just 16% in Pittsburgh see it as a strong incentive
Micro-mobility usage (bikes, e-scooters, etc.) frequency:
A large majority — 63% — of Americans have never used micro-mobility, although the option exists in their cities
~ The world wide average is 52%
Just 6% of Americans use micro-mobility on a daily basis
In Miami, 26% of commuters use micro-mobility three or more times a week
~ In Pittsburgh, 5% of commuters use micro-mobility three more times a week
Philadelphia has the most commuters — 82% — that never use micro-mobility, although the option exists

Overall, 36% of Americans rated "faster than walking" as the top reason they use micro-mobility. Bird
Micro-mobility usage type:
Of the U.S. population that uses micro-mobility daily, 50% use it to travel directly to their destination
~ In Chicago, 60% use it to travel directly to their destination
~ 51% of miamians use it to combine in with public transit
Thirty-five percent of Americans that use micro-mobility combine it with their public transit trips as the first/last segment
~ More than half (51%) of Miamians combine micro-mobility with public transit trips
Micro-mobility usage reasons:
Overall, 36% of Americans rated ‘faster than walking’ as the top reason they use micro-mobility — this was the top usage reason in every single US metro area
~ Every US metro area, except for NYC-NJ and Washington, DC-Baltimore, rated ‘affordable’ as the second top usage reason
~ The second reason for NYC-NJ is that micro-mobility is environmentally friendly (25%)
~ The second reason for Washington,DC-Baltimore is being able to park them anywhere (18%)
Micro-mobility non-usage reasons:
The top two reasons that Americans don’t use micro-mobility are: they feel it’s unsafe, and it is too difficult to find when they need it
~ Los Angeles and Miami commuters listed unsafe, and not wanting to share mandatory driving license details when signing up for an account, or not holding a driver’s license, as their top two reasons
~ More NYC-NJ commuters (25%) feel that micro-mobility options are unsafe, compared to the U.S. average (19.72%)
Twelve percent of those in the Washington, DC-Baltimore area don’t use micro-mobility because it’s annoying to use different apps for each provider
Moovit's 2019 Global Public Transport Report is comprised of big data analyzed from tens of millions of trip requests in cities across the world, in conjunction with user research in 99 metro areas across 25 countries. The result portrays a picture of global transit trends — how people commute in their cities.
Surprisingly, the numbers show public transit in the U.S., where the car has long been king, holds close to the worldwide averages for most metrics. For the U.S., data was analyzed in the Boston, Chicago, Los Angeles, Miami, New York-New Jersey, Philadelphia, Pittsburgh, San Francisco Bay, Seattle-Tacoma-Bellevue, and Washington, DC-Baltimore metropolitan areas. Metrics in the report include commute duration, wait time, walking distance, number of transfers, total trip distance, and reasons that may encourage more public transit usage. The report also includes micro-mobility metrics such as how and how often it is used, and usage and non-usage reasons.
"This report can be a very beneficial tool for any city or agency looking for an accurate picture of the infrastructure supporting daily travel habits of citizens in their cities,” said Yovav Meydad, Moovit’s Chief Growth and Marketing Officer.
More New Mobility

From Hardware to Digital Partner: Luminator Charts Its Next Chapter
CEO Magnus Friberg discusses Luminator’s shift toward becoming a digital partner, the growing importance of software and interoperability, and how AI can help agencies improve operations and passenger experience.
Read More →
Biz Briefs: Alstom Lands Canadian Contract, LYT to Supply California TSP, and More
In METRO's latest installment, we take a look at recent news from Complete Coach Works, Beep, FlixBus, and more partnerships making headlines across the transportation sector.
Read More →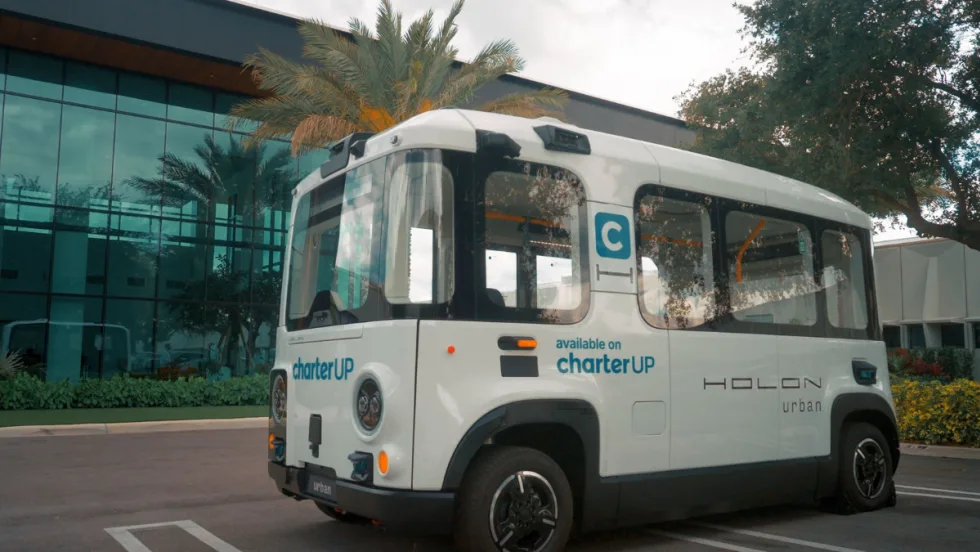
CharterUP’s Armir Harris on Technology, AI, and the Future of Group Mobility
In a recent episode of METROspectives, CharterUP Founder/CEO Armir Harris discussed the company’s evolution from an online charter bus marketplace into a technology platform supporting public- and private-sector mobility and much more.
Read More →
Jacksonville’s NAVI Project Charts a New Course for Autonomous Public Transportation
Through its NAVI program, JTA is showing how autonomous vehicles, intelligent infrastructure, and coordinated operations can work together to deliver everyday public transportation.
Read More →
Biz Briefs: Luminator Marks Milestone and More
From manufacturers and suppliers to transit agencies and motorcoach operators, these updates offer a snapshot of the projects, partnerships and business moves driving the industry forward.
Read More →
New Tricks for Old Bureaucracies: Joshua Schank on Making Transit Innovation Stick
Former LA Metro Chief Innovation Officer Joshua Schank discusses why good ideas aren't enough, how transit agencies can overcome resistance to change, and why today's challenges demand more innovation.
Read More →
How DART's GoPass Is Redefining Regional Mobility
Serving 14 transit agencies, GoPass simplifies multimodal travel by allowing riders to plan, pay for, and manage an entire trip through one app.
Read More →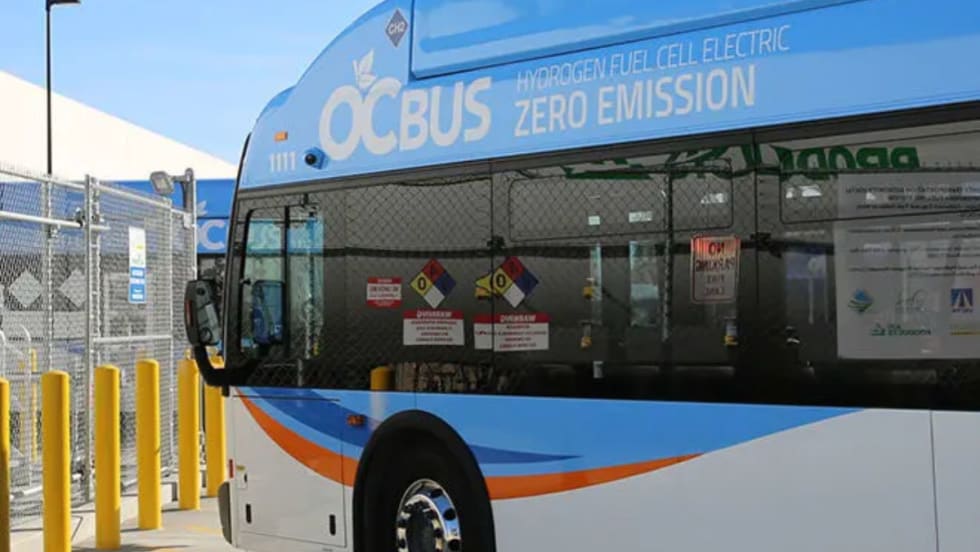
Biz Briefs: OCTA Taps Clean Energy for Hydrogen Station, Stadler to Supply Via Rail Vehicles, and More
From manufacturers and suppliers to transit agencies and motorcoach operators, these updates offer a snapshot of the projects, partnerships and business moves driving the industry forward.
Read More →CharterUP Expands Into New Mobility and Autonomous Transportation
Vice President of New Mobility Stephen Joos discusses how CharterUP is leveraging its nationwide transportation network, technology platform, and autonomous vehicle partnerships to expand into workforce mobility, campus shuttles, and transit solutions.
Read More →
METRO Magazine Announces 2026 Innovative Solutions Awards Winners
Projects Recognized for Advancing Mobility Through Technology, Accessibility, Workforce Innovation, and Operational Excellence
Read More →