

Related: Academy Bus Expands Commuter Service
Report Reveals Best, Worst Metros for Commuting in 2023
The analysis includes the top 50 largest U.S. metro areas by population.
April 27, 2023
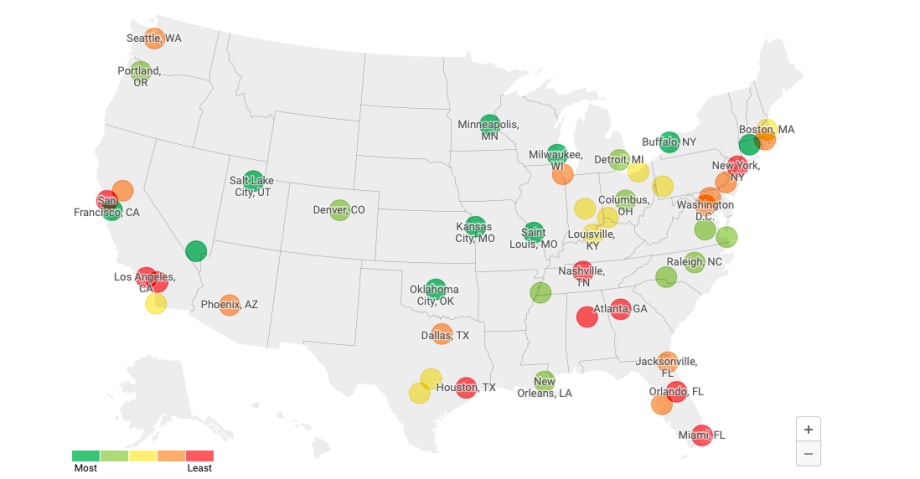
A map of the best and worst metro cities for commuters.
Photo: Yardi Kube
5 min to read
A new report from Yardi Kube presented the best and worst metro areas for commuters. Looking for the best and worst cities for commuting in the U.S? Take a look!
Buffalo is the Best
The best metro area for commuters in the US is Buffalo, NY, with a mean travel time of 20.3 minutes, one way, according to the report.
While the commuter population represents 40% of the total population in the area, only 2.3% of them spend more than 60 minutes driving to or from work.
This, along with having the shortest commute time and minimal maintenance costs associated with commuting put it at the top of the list.
Buffalo, NY, and Hartford, CT, sixth in the rankings, are the only two metro areas from the Northeast that made the top 10, the latter with an average travel time of 23.4 minutes. In Buffalo, only 2.3% of commuters spend more than 60 minutes traveling to work, while in Hartford, 4.2%.
The shorter commute times also mean lower commuting costs. For instance, in Buffalo, commuting to work entails spending 1.8% of the average $56,670 income on maintenance and fuel costs, about $1,034 per year. In Hartford, such costs amount to 1.5%, or $1,083, where the average annual income is around $71,201.
The Top 5
Four metro areas from the Midwest are on the list of the best metros for commuters. Those include Milwaukee, WI, Minneapolis, MN, Kansas City, MO, and St. Louis, MO. Milwaukee is second, with an average travel time of 21.6 minutes. In this metro, only 3% of commuters spend more than 60 minutes on a one-way commute.
The costs associated with commuting in Milwaukee are 1.6% ($1,068) of the average $66,742 annual income. Minneapolis is sixth on the list. Here, commuters spend an average of 23.4 minutes commuting to work per day, with 3.7% of commuters spending 60 minutes or more.
Commuters in Minneapolis spend $1,290 on maintenance and fuel costs related to commuting, which is about 2% of the average $64,612 annual income.
San Jose, CA, and Salt Lake City, UT take third and fourth places in the top 10, with Las Vegas, NV rounding out the only three metros from the West in the top 10 list.
San Jose commuters spend an average of 23.7 minutes traveling to work and 5.2% spend more than 60 minutes. They also spend $1,490 on commuting costs, or 1.6% of the average $94,102 income.
In Salt Lake City, commuting one-way requires about 21.7 minutes, with only 3.2% of commuters spending more than 60 minutes on the road. Here, maintenance costs and fuel due to commuting result in 1.9% of the average $60,726 annual income, or $1,140.
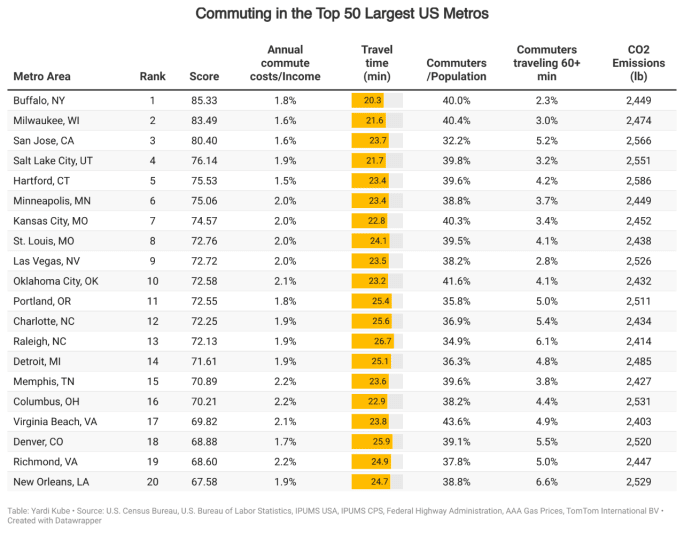
Yardi Kube looked at data from the U.S. Census Bureau 2021 ACS 1-Year Estimate for the study.
Photo: Yardi Kube
California Home to the Least-Friendly Metros for Commuters
The list of the worst metros for commuters starts with Riverside, CA. Here, commuters spend on average 32.4 minutes commuting one way and 16.4% spend more than 60 minutes. The cost associated with commuting is around $1,603, or 3.4% of the average $46,891 annual income.
Two other metro areas from California made the list: Los Angeles in second place and San Francisco in third place. In Los Angeles, the average one-way commute is about 28.2 minutes and 9.3% of commuters spend more than an hour on the road. Commuting here costs workers about 2.5% of their average $57,802 income, or $1,452.
San Francisco commuters spend about 28.3 minutes on the road and $1,569 on maintenance and fuel costs; 1.9% of the average $83,408 income. Of the total number of commuters, 9.6% spend more than an hour on a one-way commute to or from work.
San Jose, the Only California Metro Among Best for Commuters
So, how come San Jose came in third as the best metro for commuters?
Even though these four metro areas all have a similar share of commuters, there are some big differences when it comes to commuting in each. For instance, while in San Jose the average travel time to work is 23.7 minutes, in Riverside it's almost 10 minutes longer.
Also, the share of commuters that spend more than 60 minutes driving to work is more than three times higher in Riverside than it is in San Jose.
San Francisco and Los Angeles have similar numbers in both aspects, although commuting in both metros takes about 5 minutes longer than in San Jose and there are about 4% more commuters traveling for 60 minutes or more.
This is due to the long distances that commuters must travel in Riverside, Los Angeles, and San Francisco, which lead to longer commute times, higher costs, and more CO2 emissions.
The South is the Least Friendly Region
There are six Southern cities in the top 10 worst metros for commuters: Orlando, FL, Miami, FL, Houston, TX, Birmingham, AL, Atlanta, GA, and Nashville, TN.
Orlando falls in fourth place as the worst metro for commuters with an average travel time to work of 28.3 minutes and 8% of commuters spending 60 minutes or more. Commuting here results in maintenance and fuel costs of $1,198 per year, or 2.6% of an annual $45,505 income.
Miami is fifth with 28.1 minutes spent driving on average and 7.9% of commuters spending more than an hour. This results in costs amounting to $1,114, or 2.1% of an annual $52,399 income.
The New York metro area is not the worst for commuters, but it nevertheless landed in sixth place. Commuting here takes about 29.8 minutes one way and 11.5% of commuters spend more than 60 minutes on the road.
Commuters here spend 1.6% of their annual $67,100 income on maintenance and fuel costs, about $1,088.
More New Mobility
Biz Briefs: OCTA Taps Clean Energy for Hydrogen Station, Stadler to Supply Via Rail Vehicles, and More
From manufacturers and suppliers to transit agencies and motorcoach operators, these updates offer a snapshot of the projects, partnerships and business moves driving the industry forward.
Read More →
CharterUP Expands Into New Mobility and Autonomous Transportation
Vice President of New Mobility Stephen Joos discusses how CharterUP is leveraging its nationwide transportation network, technology platform, and autonomous vehicle partnerships to expand into workforce mobility, campus shuttles, and transit solutions.
Read More →
METRO Magazine Announces 2026 Innovative Solutions Awards Winners
Projects Recognized for Advancing Mobility Through Technology, Accessibility, Workforce Innovation, and Operational Excellence
Read More →Biz Briefs: STV teams with Amtrak, Motorcoach Operators Boost Fleet and Land Contracts, and More
From manufacturers and suppliers to transit agencies and motorcoach operators, these updates offer a snapshot of the projects, partnerships and business moves driving the industry forward.
Read More →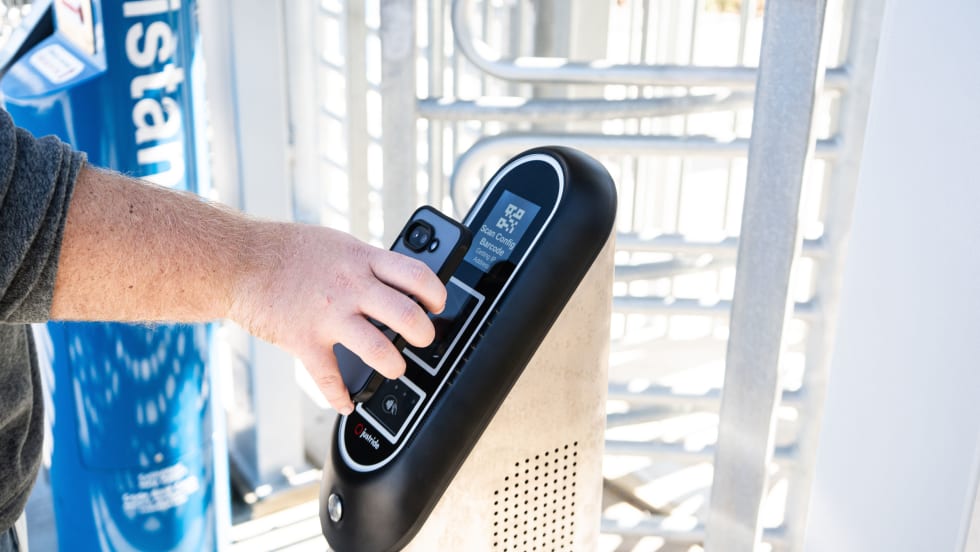
Biz Briefs: Masabi Teams with St. Louis Metro and More
In METRO's latest installment, we take a look at recent news from Transdev, Hitachi, and more partnerships making headlines across the transportation sector.
Read More →
Microtransit's Next Test: Becoming Part of the Network
Freebee shows how electric microtransit is moving beyond pilots to fill network gaps, connect riders to transit, and prove lasting value.
Read More →
Ford to Leave JTA After More Than 10 Years as CEO
He plans to continue his work advancing innovative mobility solutions to improve the quality of life in communities across the nation. He did not announce specific plans.
Read More →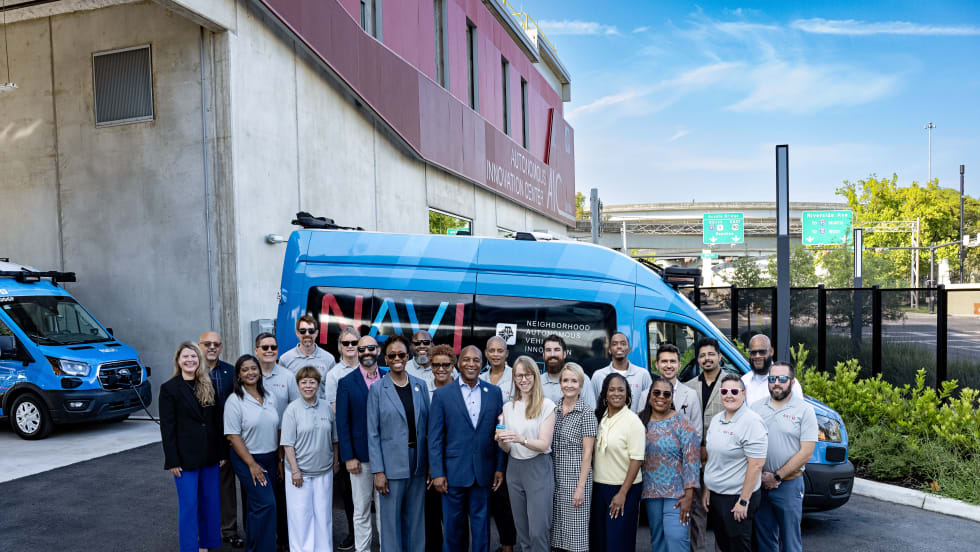
Florida's JTA Marks One Year NAVI Anniversary
During its first year of operation, NAVI has transported over 15,200 passengers and traveled more than 61,000 miles in autonomous mode without a safety incident caused by the autonomous driving system.
Read More →
SEPTA Board Approves FY2027 Budget Amid Funding Challenges
The spending plan represents an increase of just 1.9% over the current year and includes investments in new buses, additional full-length fare gates, and other customer enhancements.
Read More →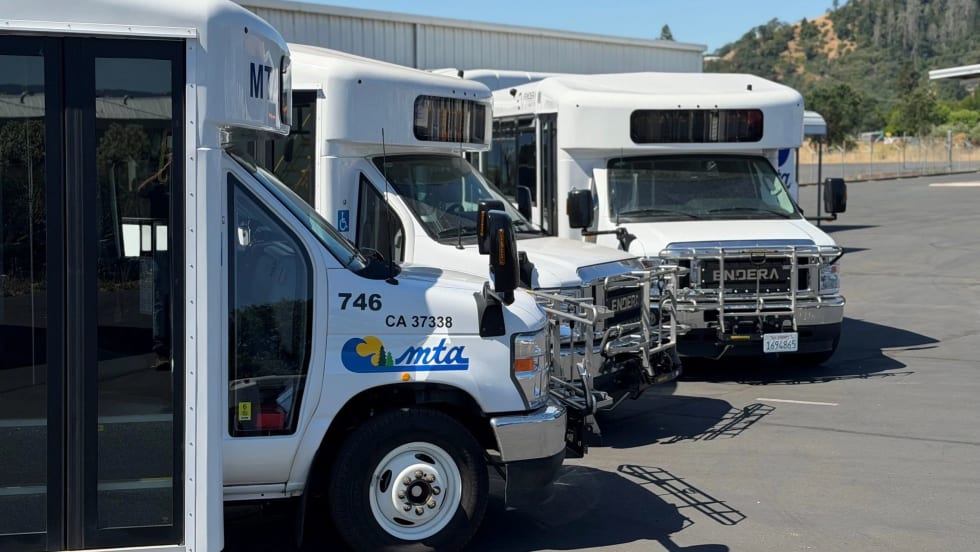
Biz Briefs: Endera Delivers to California, Safety Vision Teams with San Antonio's VIA, and More
From manufacturers and suppliers to transit agencies and motorcoach operators, these updates offer a snapshot of the projects, partnerships and business moves driving the industry forward.
Read More →