
Report: Honolulu has worst traffic gridlock in U.S.
Overall, traffic congestion in the U.S. dropped 30% in 2011, according to an annual report, which cites high unemployment and high fuel prices as contributing factors.

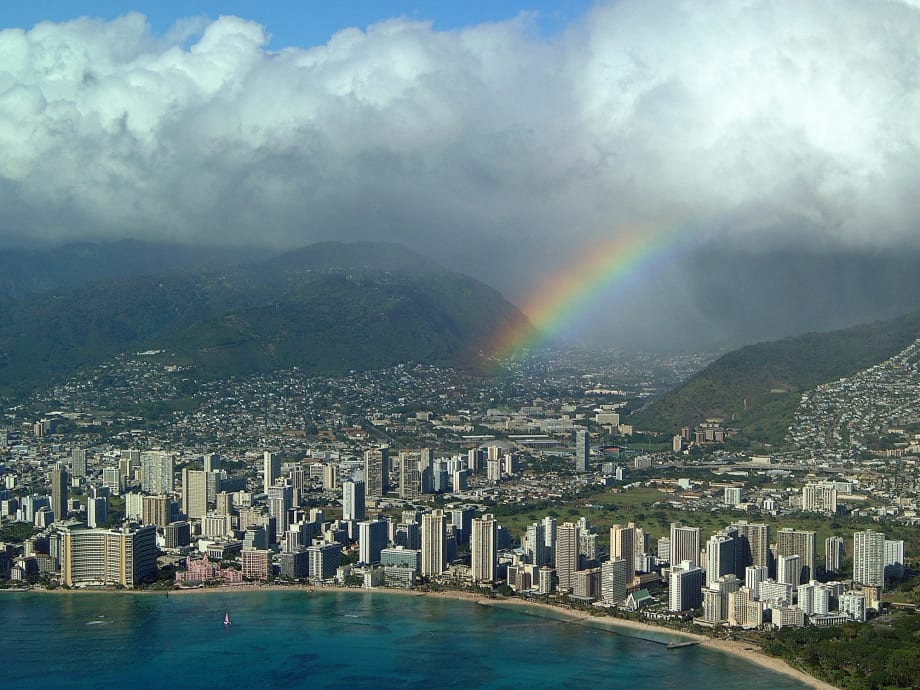
Photo courtesy Hawaii Tourism Authority (HTA) / Ron Garnett.

Traffic congestion in the U.S. dropped 30% in 2011, according to an annual report, which cites high unemployment and high fuel prices as contributing factors. Honolulu was shown to have the worst traffic, with drivers wasting 58 hours in gridlock last year.
In the first worldwide report, released by INRIX, to analyze traffic congestion, 70 of America’s Top 100 Most Populated Cities showed decreases in traffic congestion last year. These results are indicative of a “Stop-’N’-Go Economy” where lack of employment combined with high fuel prices is keeping Americans off the roads.
The drop in U.S. traffic congestion in 2011 follows two years of modest increases in 2009 (1%) and 2010 (10%). The last time America experienced a similar decline was 2008, when traffic congestion plummeted 34%. When analyzed in correlation with 2011 statistics from the FHWA, U.S. Departments of Energy and Bureau of Labor Statistics, the Scorecard provides as much insight into traffic as it does the economy:
• Cities showing the biggest drops in traffic congestion also were cities where gas prices exceeded the national average at its April 2011 peak ($3.96), including L.A. ($4.25), San Francisco ($4.25) and Honolulu ($4.48).
• Cities outpacing national employment growth (1.2%), like Tampa, Fla. (3.0%), Houston (3.2%) and Austin (2.1%), showed some of the biggest increases in traffic congestion.
• Cities with moderate employment gains and fuel prices at or below the national average ($3.52) including Atlanta ($3.32, 1.2%) and Miami ($3.52, 1.2%) also showed the biggest increases in traffic.
Last year, only 890,000 of the 2.6 million new jobs were in our nation’s largest urban centers. These regions are down 6 million of the 9 million jobs lost during the Great Recession. Lack of employment combined with high fuel prices is clearly driving the decline in traffic.
By analyzing traffic in the nation’s 100 largest metropolitan areas in 2011, the Top 10 Worst U.S. Traffic Cities are:
1. Honolulu: Drivers waste 58 hours in traffic; Worst Hour = Tuesday from 5:15 – 5:30pm.
2. Los Angeles: Drivers waste 56 hours in traffic; Worst Hour = Thursday from 5:45 – 6:00pm.
3. San Francisco: Drivers waste 48 hours in traffic; Worst Hour = Thursday from 5:45 – 6:00pm.
4. New York: Drivers waste 57 hours in traffic; Worst Hour = Friday from 5:30 – 5:45pm.
5. Bridgeport, CT: Drivers waste 42 hours in traffic; Worst Hour = Friday from 5:30 – 5:45pm.
6. Washington, D.C.: Drivers waste 45 hours in traffic; Worst Hour = Thursday from 5:45 – 6:00pm.
7. Seattle: Drivers waste 33 hours in traffic; Worst Hour = Thursday from 5:30 – 5:45pm.
8. Austin: Drivers waste 30 hours in traffic; Worst Hour = Thursday from 5:30 – 5:45pm.
9. Boston: Drivers waste 35 hours in traffic; Worst Hour = Thursday from 5:30 – 5:45pm.
10. Chicago: Drivers waste 36 hours in traffic2; Worst Hour = Thursday from 5:30 – 5:45pm.
U.S. Traffic Patterns & Worst Traffic Corridors
Nationwide, Americans traveling the nation’s worst traffic corridors experience up to 60 hours of delay annually on their afternoon commutes alone. Of the 162 corridors of at least three miles in length that experience heavy traffic congestion every day, the Top 10 Worst U.S. Traffic Corridors are:
1. Los Angeles: A 13-mile stretch of the San Diego Fwy/I-405 NB from I-105/Imperial Hwy interchange through the Getty Center Dr. exit that takes 33 minutes on average, with 20 minutes of delay.
2. New York: A 16-mile stretch of the Long Island Expy/I-495 EB from the Maurice Ave. exit to Minneola Ave./Willis Ave. exit that takes 39 minutes on average, with 22 minutes of delay.
3. Los Angeles: A 15-mile stretch of the Santa Monica Fwy/I-10 EB from CA-1/Lincoln Blvd. exit to Alameda St. that takes 35 minutes on average, with 20 minutes of delay.
4. New York: An intense three-mile stretch of I-678 NB (Van Wyck Expy) from Belt Pkwy to Main St. that takes 13 minutes on average, with 10 minutes of delay.
5. Los Angeles: A 17.5-mile stretch of I-5 SB (Santa Ana/Golden St Fwys) from E. Caesar Chavez Ave to Valley View Ave. exits that takes 40 minutes on average, with 22 minutes of delay.
6. New York: A 10-mile stretch of I-278 WB (Brooklyn Queens/Gowanus Expy) from NY-25A/Northern Blvd. to the NY-27/Prospect Expy Exits that takes 31 minutes on average, with 18 minutes of delay.
7. Los Angeles: An eight-mile stretch of I-405 SB (San Diego Fwy) from Nordhoff St. to Mulholland Dr. that takes 22 minutes on average, with 14 minutes of delay.
8. New York: A six-mile stretch of the I-678 SB (Van Wyck Expy) from Horace Harding Expy to Linden Blvd that takes 20 minutes on average, with 13 minutes of delay.
9. Pittsburgh: An intense three-mile stretch of Penn Lincoln Pkwy/I-376 EB from Lydia St. to the US-19 TK RT/PA-51 exit that takes 13 minutes on average with nine minutes of delay in the morning peak period.
10. San Francisco: An 11-mile stretch of the CA-4 EB (California Delta Hwy) from Bailey Rd to Somersville Rd. that takes 16 minutes on average, with 11 minutes of delay.
If you happen to drive any of the Top 10 Worst Corridors during rush hour you spend nearly three weeks per year stuck in traffic, and could ride a bicycle faster than you could drive your car to work. Given that these are averages, it is important to note that travel times are often much worse many days of the year.
The INRIX U.S. Scorecard also takes a micro look at traffic problems all across the country — zooming in on the total hours spent in traffic, worst day of the week for commuting and average speeds for the Top 100 U.S. cities along with hundreds of other details.
Unique patterns evolving out of U.S. traffic congestion include:
• Worst Traffic Day: Friday
• Worst Morning Commute: Tuesday
• Worst Evening Commute: Friday
• Worst Hour: Friday 5 – 6 p.m.
• Best Traffic Day: Monday
• Best Morning Commute: Friday
• Best Evening Commute: Monday
• Best Hour: Friday 6 – 7 a.m.
Big Data at Work
Available for free as a public service from INRIX, the INRIX Traffic Scorecard is the definitive source on traffic congestion. The report is the first of its kind to rank and provide detailed information on the 100 most congested U.S. metropolitan areas and the 100 worst traffic corridors nationwide. In creating the Scorecard, INRIX analyzes information for more than 300,000 miles of roads in the U.S. and 250,000 km in Europe during every hour of the day to generate the most comprehensive and timely congestion analyses available.
The Scorecard is based on analysis of billions of raw data points from INRIX’s own historical traffic database of approximately 100 million vehicles traveling the roads everyday including taxis, airport shuttles, service delivery vans, long haul trucks and passenger cars. Each data report from these GPS-equipped vehicles and devices includes the speed, location and heading of a particular vehicle at a reported date and time.
More information about INRIX Traffic can be found at http://inrixtraffic.com or to see the complete Traffic Scorecard, visit: http://inrix.com/scorecard.
More Bus
Biz Briefs: STV teams with Amtrak, Motorcoach Operators Boost Fleet and Land Contracts, and More
From manufacturers and suppliers to transit agencies and motorcoach operators, these updates offer a snapshot of the projects, partnerships and business moves driving the industry forward.
Read More →
LA Metro Marks Banner Year, Sets Ambitious Goals for New Fiscal Year
Incoming LA Metro Board Chair and Los Angeles Mayor Karen Bass joined outgoing Board Chair Fernando Dutra and LA Metro CEO Stephanie Wiggins to review accomplishments from fiscal year 2026, which included the opening of new rail extensions, advancement of major transit projects, expanded safety programs, and new rider amenities.
Read More →
DART Taps Nathaniel P. Ford Sr. as Next President/CEO
Since 2012, Ford has served as the CEO of the Jacksonville Transportation Authority
Read More →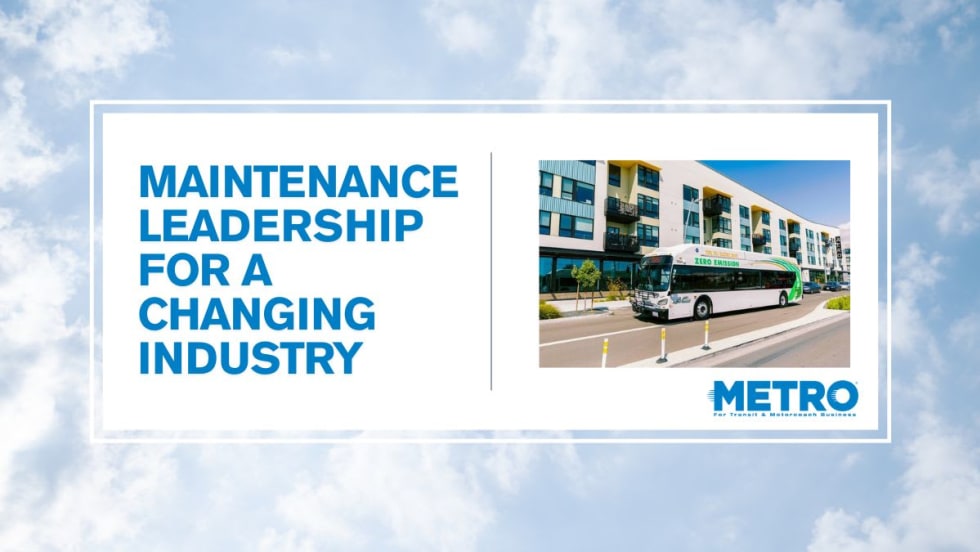
AC Transit’s Cecil Blandon on Building the Next Generation of Transit Maintenance Leaders
The agency’s maintenance chief discusses leadership, workforce development, zero-emission technology, and preparing technicians for the future of public transportation.
Read More →
Building the Next Generation of Transit Technology
In this edition of METROspectives, Luminator CEO Magnus Friberg discusses the company's transformation, the growing role of AI and software, and what's next for transit technology.
Read More →
June LA Metro Ridership Surges 2 Million Year Over Year
Total June ridership increased for both weekdays and weekends. Weekday ridership was 953,820, which grew 8.4% from June 2025; Saturdays increased nearly 13% year-over-year to 708,826; and Sundays increased 7.7% to 611,534 from June 2025, according to LA Metro.
Read More →
Washington's Pierce Transit Board Sends Transit Funding Measure to November Ballot
With the adoption of Resolution 2026-006, the measure moves to the Pierce County Auditor, giving voters in the Pierce Transit service area the decision on whether to fund an expansion of local transit service within the agency’s service area.
Read More →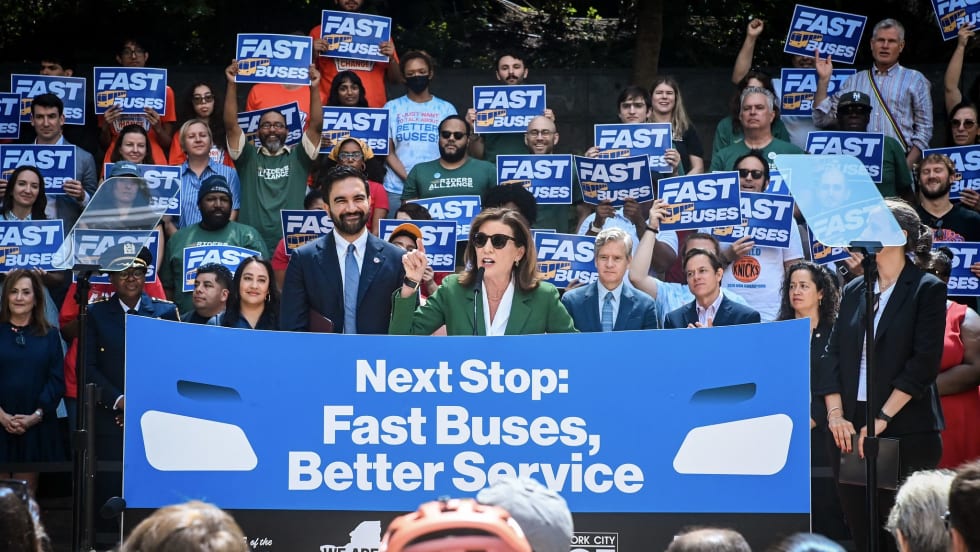
New York Unveils Sweeping Plan to Modernize City Bus Service
Next Stop: Fast Buses, Better Service identifies 50 priority bus corridors for improvements across the five boroughs and launches the City’s next generation of rapid bus service along five key routes.
Read More →
CTDOT Taps STV for Electric Bus Facility Design
The firm will work with CTDOT and RVT to define the facility layout, operational requirements, and long-term flexibility for RVT’s growing electric fleet.
Read More →
Ford to Leave JTA After More Than 10 Years as CEO
He plans to continue his work advancing innovative mobility solutions to improve the quality of life in communities across the nation. He did not announce specific plans.
Read More →