
World’s largest metro regions serve only half their populations (at best) with mass transit
The rapid transit systems of Seoul and Beijing, the two largest cities in the survey, served the most people by far. Almost 11 million people live within 1 km (.62 miles) of each system.

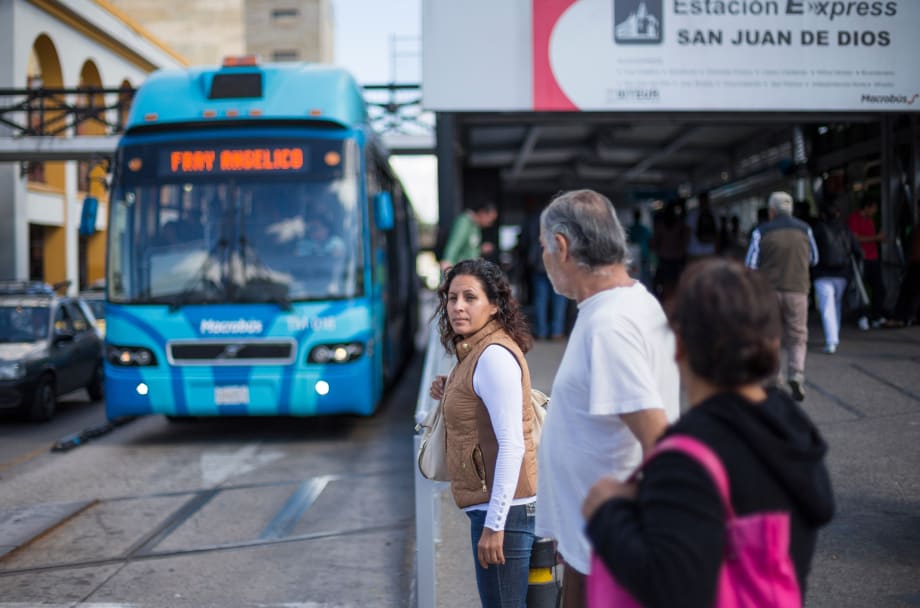
Photos courtesy ITDP

Many of the world’s most important cities are expanding rapidly without adequate transportation planning, according to a new report released by the Institute for Transportation and Development Policy (ITDP). The report measures the number of urban residents who are within a short walking distance to rapid transit with a new metric, People Near Rapid Transit (PNT), and applies the metric to 26 major cities and their greater metro regions around the world. Of the cities surveyed, the city of Paris earned a perfect score and the metro regions of Washington, D.C., and Los Angeles were among the worst.
“The PNT metric illustrates how unplanned urban and suburban growth focuses on automobiles and only those who can afford to drive,” said Clayton Lane, ITDP’s CEO. “Washington, D.C., Paris, and Beijing are major examples of cities that have expanded beyond prescribed political boundaries without effective regional transport plans. Larger integrated rapid-transit networks serve more people and limit climate change — but they don’t grow without foresight and planning.”
The PNT metric was established by ITDP researchers to measure the number of residents who live within 1 km (.62 miles) of rapid transit. The report, People Near Transit: Improving Accessibility and Rapid Transit Coverage in Large Cities, applies the metric to 26 cities around the world with high-capacity mass transit systems and the greater metropolitan regions anchored by these cities.

The report establishes five basic criteria for high-quality rapid transit, drawn from ITDP’s BRT Standard and other publications:
Passengers purchase their fare in the station before boarding;
Transit has consistent distances between stations that does not exceed 5km (3 miles);
Passengers have at most a 20-minute wait at every station between 6am and 10pm;
For bus transit, vehicles must have their own lanes and a dedicated Right-of-Way; and
For rail transit, tracks must have a dedicated Right-of-Way physically separated from street traffic.
Very few cities are investing in the rapid transit systems that serve the less wealthy communities living outside of the urban core, even in Europe and especially in North America. For the 13 cities in industrialized countries that were scored, the average PNT was 68.5%, while those cities’ metropolitan regions averaged 37.3%. The metro regions of the six US cities averaged a score of 17.2%.
“Mass transit systems should grow as cities grow; yet in most cities, governments still rely on automobile traffic as the primary way of getting people around,” noted Lane. “In today’s megacities, road space is already massively congested with car ownership presently at only 10-30 percent, yet building more roads remains a misguided top infrastructure priority. Governments need to better serve the other 70-90 percent of the population without cars, and provide better mobility choices for everyone.”
The rapid transit systems of Seoul and Beijing, the two largest cities in the survey, served the most people by far. Almost 11 million people live within 1 km (.62 miles) of each system and their scores reflect the population density.
Rapid Transit is Vitally Important for Lower Income Communities
Increasingly, the outlying regions of cities are home to less wealthy communities. A recent report from the Brookings Institution found that the poor population in U.S. suburbs grew faster than anywhere else in the country, surging 64 percent in the past decade. Similar trends have already emerged in most countries around the world. Without a corresponding increase in rapid transit access, the poverty in these areas becomes entrenched, as the lack of transportation limits access to jobs and education in other parts of the cities.
For the cities measured in low- and middle-income countries, the average PNT score was 40.3%, while the metropolitan regions averaged 23.7%. Of these cities, the rapid transit systems in Jakarta and Quito did not extend past the city borders. Almost all of the other systems only served a small fraction of the population living in these outlying areas.
“In many cities, it’s far too easy for municipal governments to ignore the problems on the other side of their borders,” Lane observed. “But cities today do not exist in a vacuum. All metropolitan regions have an urban core, as well as surrounding communities. People in the outer regions cannot thrive without better transportation connections to the core and other outer communities. Government relationships across city and state lines are crucial to meeting the needs of their populations.”

A Critical Tool in Efforts to Limit Climate Change
Expanding and optimizing rapid transit is also critical to achieving climate change targets. According to the U.S. Environmental Protection Agency, cars, light trucks and SUVs generate one-fifth of all carbon dioxide emissions in 2014 that result from burning fossil fuels in the U.S.
Governments cannot limit these emissions without rapid transit and compact urban development. In a report released two years ago that ITDP produced in collaboration with the University of California, Davis, researchers estimated that more than $100 trillion in cumulative public and private spending, and 1,700 megatons of annual carbon dioxide (CO2) — a 40 percent reduction of urban passenger transport emissions — could be eliminated by 2050 if the entire world expands public transportation, walking and cycling in cities.
“The impacts from climate change could still be mitigated if there is enough political will,” concluded Lane. “The continuing construction of car-oriented development found in metropolitan regions all over the world is a perfect example of this tragedy. Rapid transit integration, including rail, bus, cycling, walking, and shared car networks could connect these places sustainably to a wealth of opportunities.”
More Management

Massachusetts Approves $530M to Strengthen MBTA Operations, Infrastructure
The funding package targets operating stability, capital improvements, and fare affordability, offering a model for agencies navigating long-term funding challenges.
Read More →
LA Metro Marks Banner Year, Sets Ambitious Goals for New Fiscal Year
Incoming LA Metro Board Chair and Los Angeles Mayor Karen Bass joined outgoing Board Chair Fernando Dutra and LA Metro CEO Stephanie Wiggins to review accomplishments from fiscal year 2026, which included the opening of new rail extensions, advancement of major transit projects, expanded safety programs, and new rider amenities.
Read More →
DART Taps Nathaniel P. Ford Sr. as Next President/CEO
Since 2012, Ford has served as the CEO of the Jacksonville Transportation Authority
Read More →
AC Transit’s Cecil Blandon on Building the Next Generation of Transit Maintenance Leaders
The agency’s maintenance chief discusses leadership, workforce development, zero-emission technology, and preparing technicians for the future of public transportation.
Read More →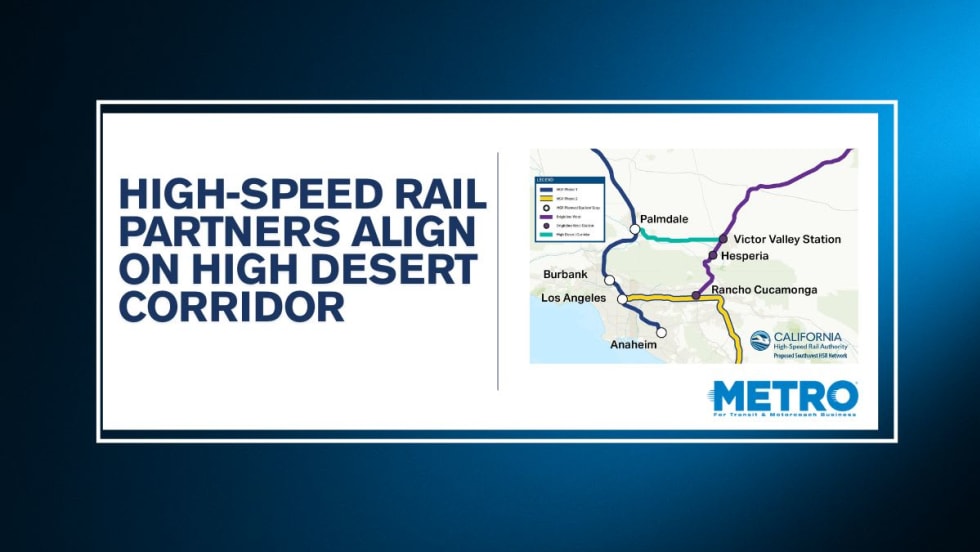
California High-Speed Rail Authority Signs MOU to Advance High Desert Corridor
The agreement deepens collaboration between the California High-Speed Rail Authority and the High Desert Corridor Joint Powers Agency, supporting design integration, cost savings, and faster delivery of a key Southern California rail link.
Read More →
Building the Next Generation of Transit Technology
In this edition of METROspectives, Luminator CEO Magnus Friberg discusses the company's transformation, the growing role of AI and software, and what's next for transit technology.
Read More →
How Data, Strategy, and Community Engagement Are Reshaping Transit
In this edition of METROspectives, strada360 CEO Steve Lassey discusses how transit agencies can better align planning with operations, leverage data to improve decision-making, and build public trust as they prepare for the future of mobility.
Read More →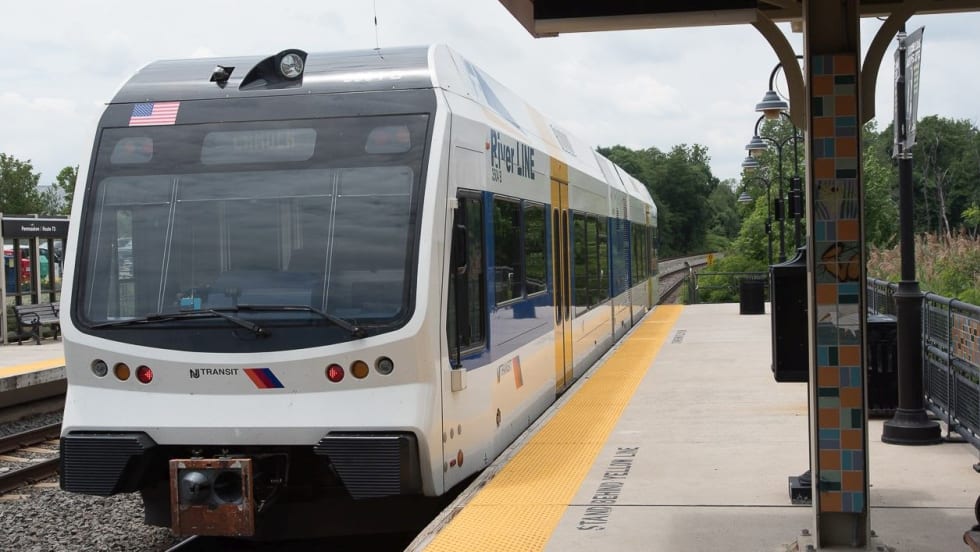
NJ TRANSIT Secures Capital Funding, Adopts FY2027 Budget
The budgets continue investments in infrastructure and equipment to maintain the system in a state of good repair and enhance the overall customer experience.
Read More →
Federal Railroad Administration Study Finds Upgrades Could Boost Penn Station Capacity by One-Third
The study outlines a roadmap for increasing train throughput while preparing Penn Station for future growth across the Northeast Corridor.
Read More →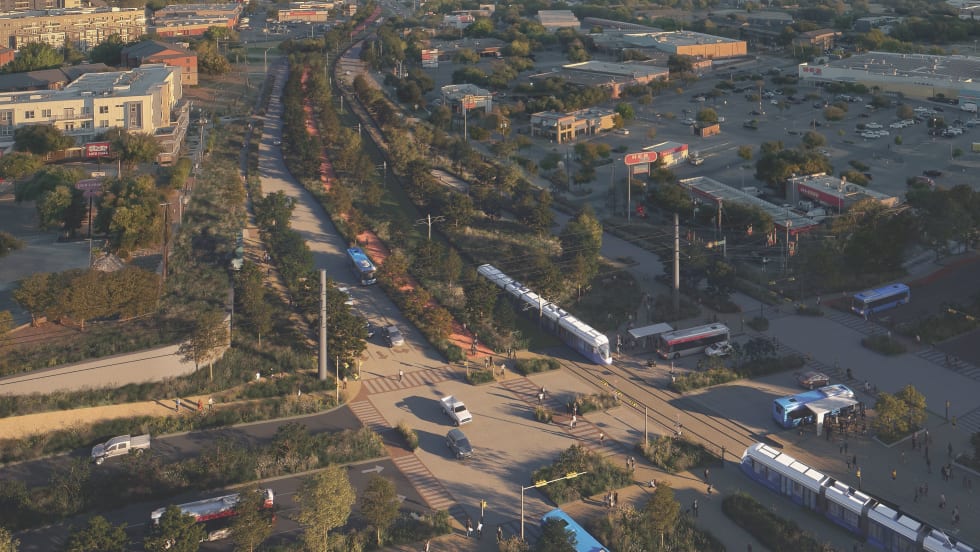
Austin Transit Partnership Selects Stadler to Manufacture Light Rail Vehicles
The award marks the conclusion of a series of major procurements over 18 months, as outlined in ATP’s delivery plan, and keeps Austin Light Rail on track.
Read More →