
Congestion cost Americans nearly $88 billion in 2019, report says
For the second consecutive year, Boston ranked as the most congested city in the U.S.

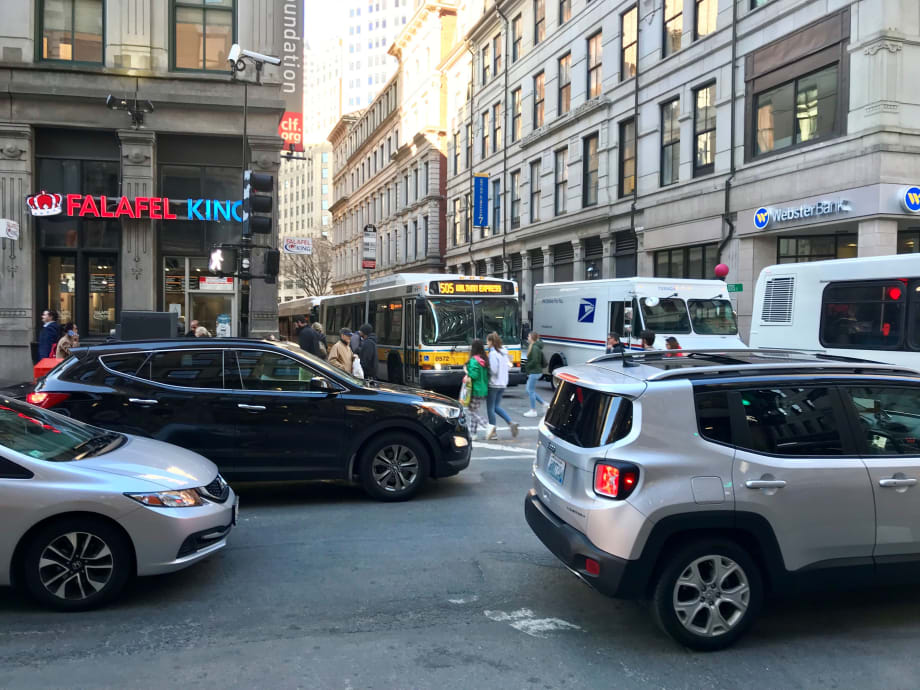

For the second consecutive year, Boston ranked as the most congested city in the U.S. J. Starcic
On average, Americans lost 99 hours a year due to congestion, costing them nearly $88 billion in 2019, an average of $1,377 per year, according to a new report. From 2017 to 2019 the average time lost by American drivers has increased by two hours as economic and urban growth continue nationally.
The 2019 Global Traffic Scorecard, published by INRIX Inc., identified and ranked congestion and mobility trends in more than 900 cities, across 43 countries.
In the U.S., the 2019 Global Traffic Scorecard analyzed congestion and the severity of it in the top 66 urban areas. For the second consecutive year, Boston ranked as the most congested city in the U.S. with the average commuter in the metro area losing 149 hours per year to congestion, costing $2,205 per driver in time lost.
Chicago (145 hours, $2,059 lost), Philadelphia (142 hours, $2,016 lost), New York City (140 hours, $1,988 lost) and Washington, D.C. (124 hours, $1,761 lost) rounded out the Top 5. While known historically for its congestion, Los Angeles’ (ranked sixth in congestion; 103 hours lost in 2019) constant gridlock does not have the severity as the other top-ranked cities due to its sprawling geography and massive road network. On the other hand, Wichita, Kansas, for the second year in a row, had the lowest congestion levels in the U.S. with drivers losing less than two hours a year.
“Congestion costs Americans billions of dollars each year. However, it appears to be stabilizing in some of the country’s most congested metros – with delays raising roughly three percent nationwide since 2017,” said Trevor Reed, transportation analyst at INRIX. “The continued innovation and investment in smarter roadway management is showing early signs of progress. To reflect an increasingly diverse mobility landscape, the 2019 Global Traffic Scorecard includes both public transport and biking metrics for the first time.”
Table 1: 10 Most Congested Urban Areas in the U.S.

The Most Congested Corridors in the U.S.
Los Angeles holds the top two worst corridors in the U.S., where drivers on the US-101 and I-5 waste 80 and 76 hours per year at peak hours in congestion, respectively. In each case, the corridor uniquely serves a large geographic area with limited alternatives. In the case of US-101, it cuts through the Hollywood Hills, while I-5 runs diagonally into the downtown core across numerous other highways.
The list of corridors is dominated by the Top 5 most congested cities in the U.S., accounting for seven of the 10 worst. Surprisingly, Tampa Bay’s I-275 comes in at number nine, despite Tampa’s absence on the Top 25 Most Congested Cities list.
Table 2: 10 Most Congested U.S. Roads in 2019

How U.S. Cities Compare to Top Cities Worldwide
At the global level, Bogota topped the list of the cities most impacted by traffic congestion with drivers losing 191 hours a year to congestion followed by Rio de Janeiro (190 hours), Mexico City (158 hours) and Istanbul (150 hours). Latin American and European cities again dominated the Top 10, highlighting the rapid urbanization occurring in Latin America and cities ill-suited to automobile use in Europe.
Table 3: 10 Most Congested Cities in the World in 2019

Access to reliable data is the first step in tackling congestion. Applying big data to create intelligent transportation systems is key to solving urban mobility problems. INRIX data and analytics on traffic, parking and population movement help city planners and engineers make data-based decisions to prioritize spending in order to maximize benefits and reduce costs now and for the future.
The key findings of the INRIX 2019 Global Traffic Scorecard provide a quantifiable benchmark for governments and cities across the world to measure progress to improve urban mobility and track the impact of spending on smart city initiatives.
More Management
Biz Briefs: STV teams with Amtrak, Motorcoach Operators Boost Fleet and Land Contracts, and More
From manufacturers and suppliers to transit agencies and motorcoach operators, these updates offer a snapshot of the projects, partnerships and business moves driving the industry forward.
Read More →
Massachusetts Approves $530M to Strengthen MBTA Operations, Infrastructure
The funding package targets operating stability, capital improvements, and fare affordability, offering a model for agencies navigating long-term funding challenges.
Read More →
LA Metro Marks Banner Year, Sets Ambitious Goals for New Fiscal Year
Incoming LA Metro Board Chair and Los Angeles Mayor Karen Bass joined outgoing Board Chair Fernando Dutra and LA Metro CEO Stephanie Wiggins to review accomplishments from fiscal year 2026, which included the opening of new rail extensions, advancement of major transit projects, expanded safety programs, and new rider amenities.
Read More →
DART Taps Nathaniel P. Ford Sr. as Next President/CEO
Since 2012, Ford has served as the CEO of the Jacksonville Transportation Authority
Read More →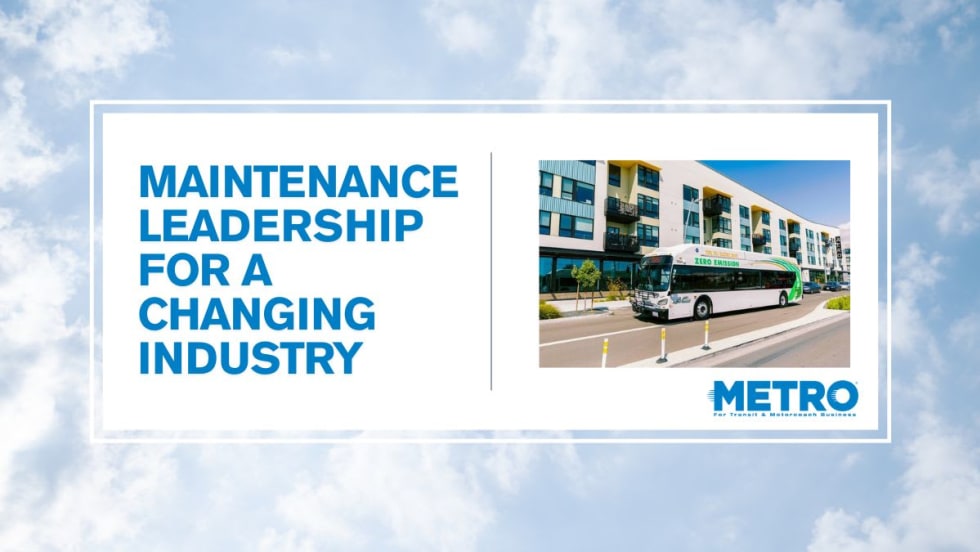
AC Transit’s Cecil Blandon on Building the Next Generation of Transit Maintenance Leaders
The agency’s maintenance chief discusses leadership, workforce development, zero-emission technology, and preparing technicians for the future of public transportation.
Read More →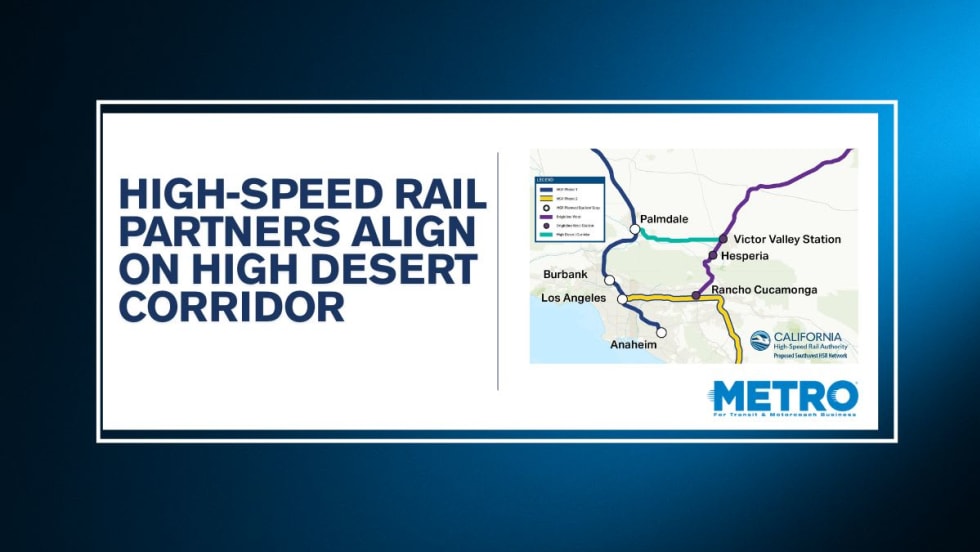
California High-Speed Rail Authority Signs MOU to Advance High Desert Corridor
The agreement deepens collaboration between the California High-Speed Rail Authority and the High Desert Corridor Joint Powers Agency, supporting design integration, cost savings, and faster delivery of a key Southern California rail link.
Read More →
Building the Next Generation of Transit Technology
In this edition of METROspectives, Luminator CEO Magnus Friberg discusses the company's transformation, the growing role of AI and software, and what's next for transit technology.
Read More →
How Data, Strategy, and Community Engagement Are Reshaping Transit
In this edition of METROspectives, strada360 CEO Steve Lassey discusses how transit agencies can better align planning with operations, leverage data to improve decision-making, and build public trust as they prepare for the future of mobility.
Read More →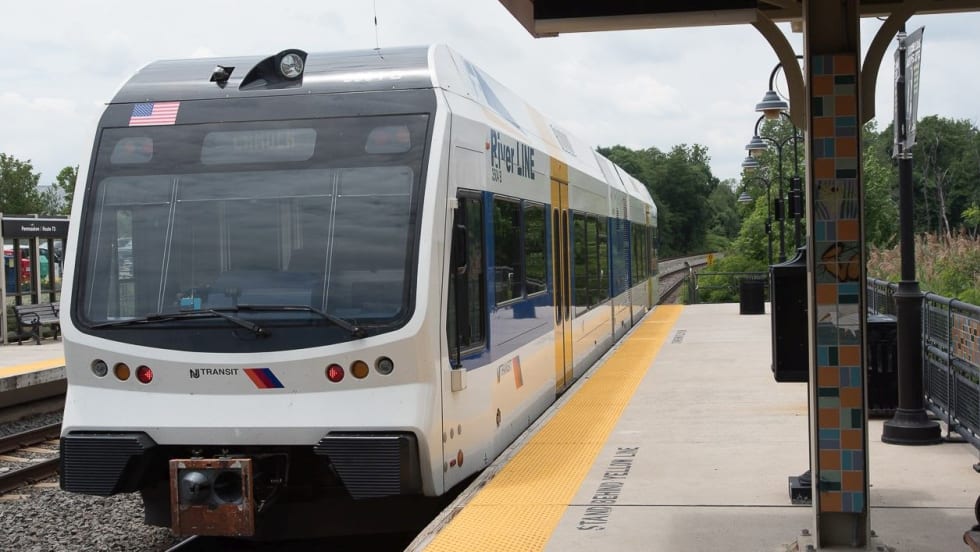
NJ TRANSIT Secures Capital Funding, Adopts FY2027 Budget
The budgets continue investments in infrastructure and equipment to maintain the system in a state of good repair and enhance the overall customer experience.
Read More →
Federal Railroad Administration Study Finds Upgrades Could Boost Penn Station Capacity by One-Third
The study outlines a roadmap for increasing train throughput while preparing Penn Station for future growth across the Northeast Corridor.
Read More →