

Miss This?Denver's RTD Adding 27,000 Service Hours
Denver RTD Reports Strong Gains in Customer Satisfaction and Service Performance
Survey results reflect rider-reported improvements in safety, vehicle cleanliness, on-time performance, and the agency’s overall value
June 23, 2025
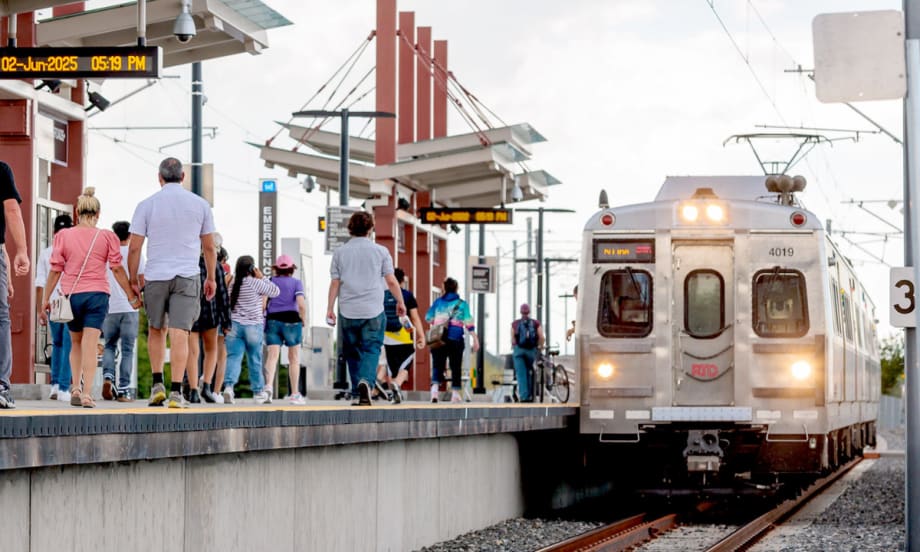
The Regional Transportation District's (RTD) survey results highlighted that “getting to work” is the primary reason people use its bus and rail services, up more than 7% from 2024.
Photo: Regional Transportation District
4 min to read
Recent customer and community surveys conducted by Denver’s Regional Transportation District (RTD) show double-digit, year-over-year improvements in several categories.
Perceptions of personal safety and security, the cleanliness of buses and trains, on-time performance, the frequency of service, and the agency’s overall value in the Denver metro area were major points of interest in the surveys. RTD’s bus operations exceeded the national average for transit agencies in all 16 comparative categories, and rail operations exceeded the national average in 15 of the 16 comparative categories.
“The survey results reflect RTD’s direct impact and value public transit has across the communities it serves within the Denver metro area,” GM/CEO Debra A. Johnson said.
The survey results also highlighted that “getting to work” is the primary reason people use RTD’s bus and rail services, up more than 7% from 2024.
“Over the last year, the agency has implemented several consequential tactics related to creating a Welcoming Transit Environment and enhancing the customer experience,” Johnson said. "The results of RTD’s strategic and multi-faceted efforts are evident. And, while I am encouraged to see that RTD is nationally leading the way across several categories, the agency remains focused on the future and continuous improvement.”
Bus, Rail, and Paratransit Show Systemwide Improvements
RTD’s latest customer satisfaction results show year-over-year improvements across bus, rail, and paratransit services, with rising ridership reliance, higher Net Promoter Scores (NPS), and strong community support. Statistical highlights include:
Bus Customers
78% of respondents are reliant on RTD’s services.
85% agree or strongly agree that RTD provides value to the community.
71% use RTD’s services three or more days a week.
8% year-over-year increase in overall satisfaction.
11% increase in customers feeling safe and secure while waiting at a stop.
13% increase in customers, indicating the vehicles are clean.
7% increase in customers satisfied or very satisfied with the frequency of service.
3% increase in customers, indicating bus operators are courteous.
Bus exceeded the national average across all 16 comparative categories.
Bus’s NPS is +26, and the national average is -16.
The factors of most importance to bus customers are (1) frequency of service, (2) hours of operation, (3) stop location, (4) fare price, and (5) timely arrival of buses.
Rail Customers
65% of respondents are reliant on RTD’s services.
59% use RTD’s services three or more days a week.
12% year-over-year increase in overall satisfaction.
17% increase in customers, indicating the trains are clean.
7% increase in customers satisfied or very satisfied with the frequency of service.
10% increase in customers, indicating the trains run on time.
14% increase in customers feeling safe and secure while riding the train.
12% increase in customers feeling safe and secure while waiting at a station.
5% increase in customers, indicating rail operators are courteous
Rail exceeded the national average in 15 of the 16 comparative categories.
Rail’s NPS is +31, and the national average is -3.
The factors of most importance to light rail customers are (1) frequency of service, (2) station location, (3) fare price, (4) hours of operation, and (5) timely arrival of trains.
Paratransit Customers
85% of Access-a-Ride customers are satisfied or very satisfied.
96% of Access-on-Demand customers are satisfied or very satisfied.
Access-a-Ride’s Net Promoter Score is +54.
Access-on-Demand’s Net Promoter Score is +81.
Community
Getting to work is the No. 1 reason people use RTD’s services, up 7% from 2024.
11% increase in the community, indicating that RTD provides value to them personally.
82% believe their investment in RTD provides value.
83% indicate RTD is valuable or extremely valuable at reducing pollution and achieving sustainable practices.
90% feel that RTD vehicles are mechanically safe.
80% feel RTD is valuable or extremely valuable at reducing traffic congestion.
RTD's Data Collection and Methodology
For the fifth consecutive year, RTD commissioned a comprehensive survey of its customers and the community to understand the agency’s strengths better and identify improvement opportunities.
In April, research firm ETC Institute conducted the annual surveys and provided comparative national data and benchmarks. Four separate statistically valid surveys were conducted to understand customer and community perceptions, attitudes, experiences, and opinions. RTD collected data proportionate to boardings across all bus routes and rail lines through a customer intercept method.
The NPS is an important metric provided by RTD’s customer and community surveys and measures the likelihood of a person recommending RTD’s services to someone else. RTD’s combined customer NPS increased 24 points in 2025, and the score is up 13 points for bus and 19 points for rail. The across-the-board positive NPS means RTD has more individuals promoting its services than acting as detractors.
All surveys were conducted in English and Spanish, with language assistance available in an additional 20 languages and accommodations for visually impaired customers. Surveys were administered to a representative sample of the customer and community population to ensure the results were statistically valid.
More information about the surveys’ methodology and confidence intervals is available on RTD’s website.
More Security and Safety
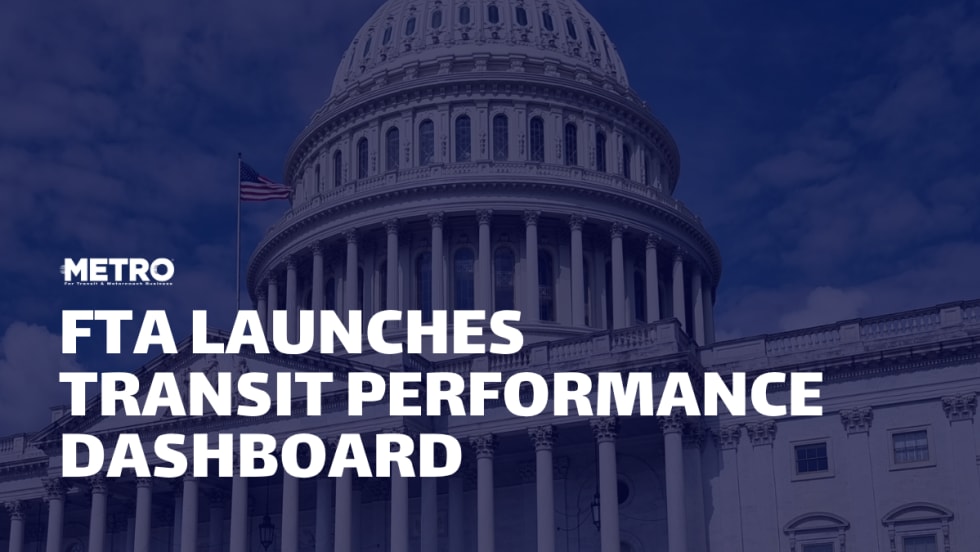
FTA Launches 'Transit Moves America' Dashboard to Highlight Agency Safety and Performance
The online dashboard transforms National Transit Database information into a public-facing resource that allows users to compare transit agencies on key operational and safety metrics.
Read More →
LA Metro Marks Banner Year, Sets Ambitious Goals for New Fiscal Year
Incoming LA Metro Board Chair and Los Angeles Mayor Karen Bass joined outgoing Board Chair Fernando Dutra and LA Metro CEO Stephanie Wiggins to review accomplishments from fiscal year 2026, which included the opening of new rail extensions, advancement of major transit projects, expanded safety programs, and new rider amenities.
Read More →
Building the Next Generation of Transit Technology
In this edition of METROspectives, Luminator CEO Magnus Friberg discusses the company's transformation, the growing role of AI and software, and what's next for transit technology.
Read More →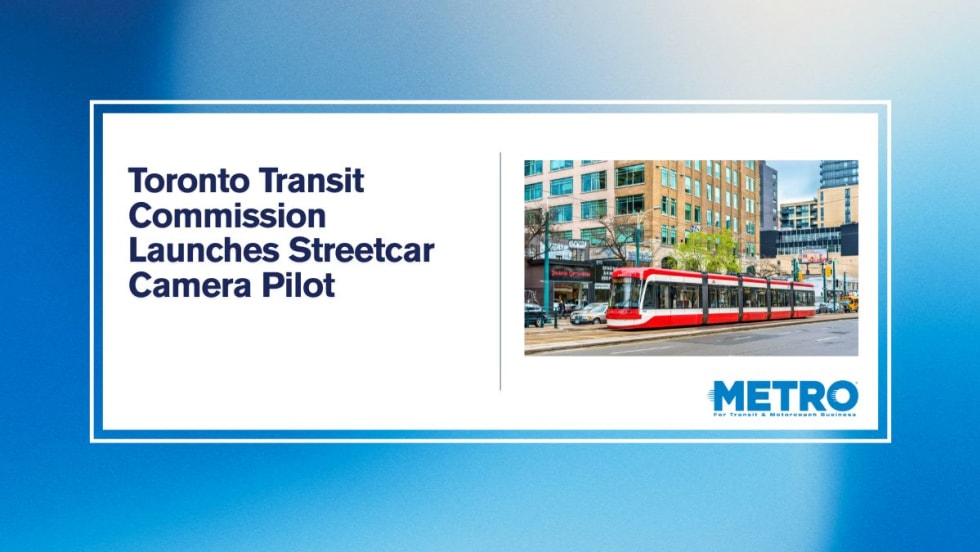
TTC Launches Camera Pilot to Curb Illegal Passing of Streetcars
During the pilot, the cameras will measure how often illegal streetcar passing occurs and test the technology's reliability for future automated enforcement.
Read More →
Biz Briefs: Masabi Teams with St. Louis Metro and More
In METRO's latest installment, we take a look at recent news from Transdev, Hitachi, and more partnerships making headlines across the transportation sector.
Read More →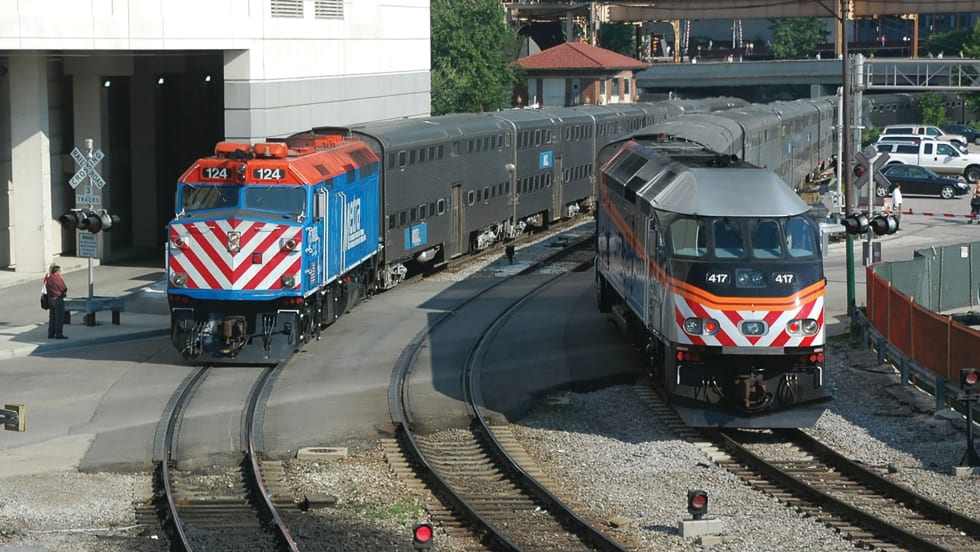
Metra Begins Drone Pilot Project to Boost Safety and Security
The project is funded through a $620,000 grant from FEMA’s Transit Security Grant Program, which provides transit agencies with funding for projects intended to protect critical transportation infrastructure and the traveling public.
Read More →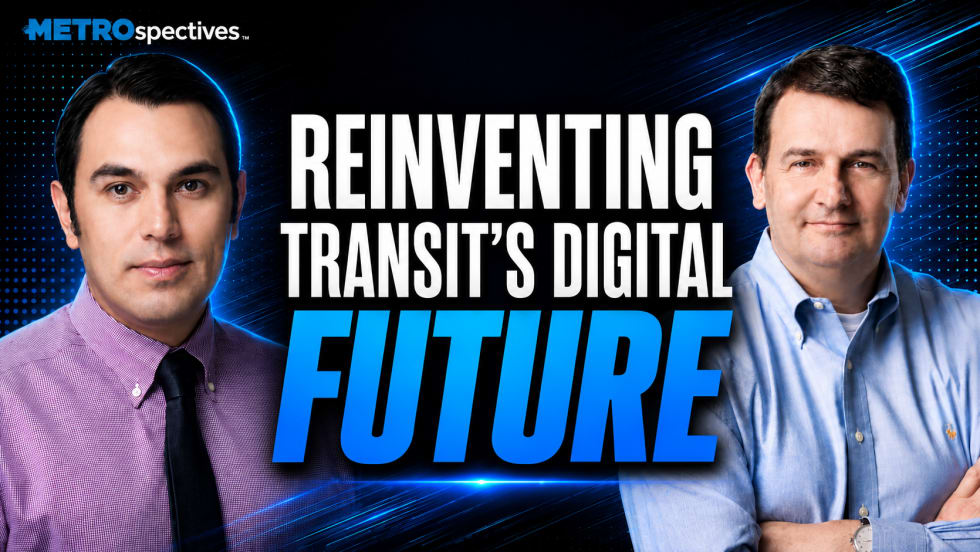
Building the Next Generation of Transit Technology
In this edition of METROspectives, Luminator CEO Magnus Friberg discusses the company's transformation, the growing role of AI and software, and what's next for transit technology.
Read More →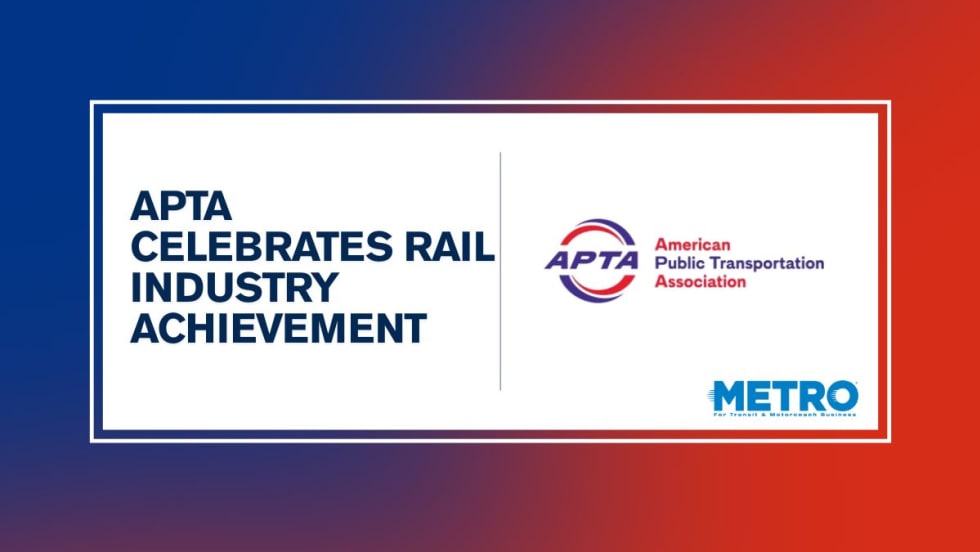
APTA Recognizes Excellence in Rail Safety and Security at 2026 Rail Conference
Nominations are evaluated on four criteria: effectiveness, benefit level, innovation, and transferability.
Read More →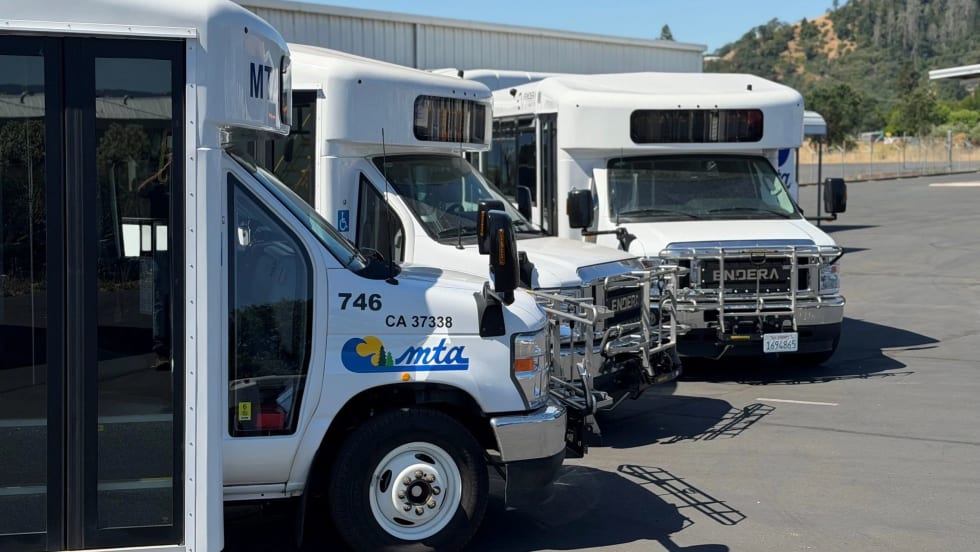
Biz Briefs: Endera Delivers to California, Safety Vision Teams with San Antonio's VIA, and More
From manufacturers and suppliers to transit agencies and motorcoach operators, these updates offer a snapshot of the projects, partnerships and business moves driving the industry forward.
Read More →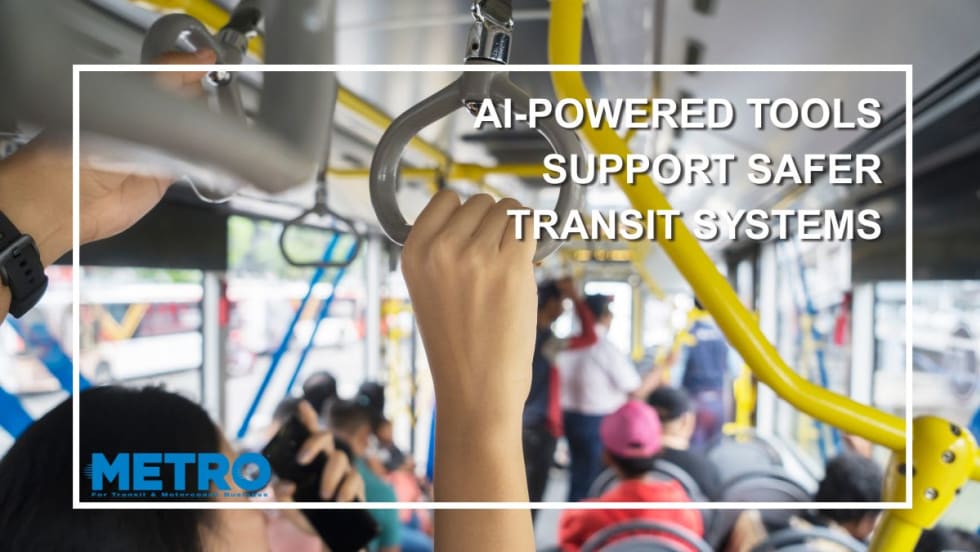
The Role of AI in Public Safety for Smart Transit Systems
As transit systems generate more data than ever, AI-powered safety tools are helping agencies detect incidents faster, improve response times and enhance situational awareness.
Read More →