


FIVE MUSTS
Essential elements for acceptable on-time performance:
1. Adequate and accurate running times between timepoints (including adequate pullout deadhead times)
2. Adequate recovery time
3. Enough trained, qualified vehicle operators
4. Enough equipment (transit vehicles) available for use
5. Enough trained supervisors to monitor and adjust service as necessary
Improving transit on-time performance
This first of a two-part series explores causes for poor on-time performance and data considerations to adjust vehicle schedules.
by Arthur N. Gaudet
November 19, 2019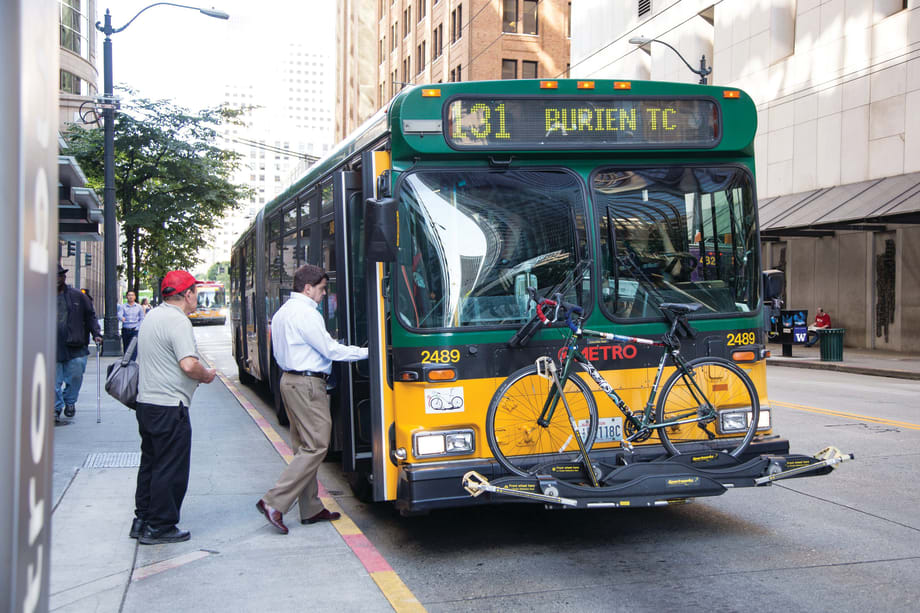
When passengers want to ride, they don’t care what time the bus arrives or where it comes from. They want to be sure the bus does not leave before the appointed time.
King County Metro
6 min to read
When passengers want to ride, they don’t care what time the bus arrives or where it comes from. They want to be sure the bus does not leave before the appointed time.
King County Metro
On-time performance (OTP), otherwise known as schedule adherence, should not just be a number. Poor OTP should be a call to action. Passengers’ lives are affected when we don’t keep promises and fail to adhere to the printed timetable. They don’t get to work on time, so their jobs (or wages) are at risk. Students miss class. Missed medical appointments can result in serious health issues for passengers, and increased costs for the health care industry.
While there are formulas to forecast elasticity (ridership increase/decrease) for fare changes (Simpson-Curtin) and for changes in frequency (TCRP Report 95, Chapter 12), there are no known formulas that address quality of service as a determinant of transit usage. Studies have shown many potential factors in declining transit usage in many cities, including telecommuting, re-urbanization, and transportation network companies. Although unprovable, it is reasonable to assume that reliability (OTP) is also a factor in modal choice.
OTP is transit system specific. Some systems do well, reporting OTP in the 90%+ range, while other systems struggle. In one example, a mid-size system was shifting from directly operated to a contracted service. The RFP provided to potential bidders included a stated goal to increase their OTP to 60%. What does that mean? Only four out of 10 buses would leave timepoints “on-time.”
Defining OTP in the Real World
Two definitions are frequently seen:
Leaving a timepoint zero minutes early, up to five minutes late.
Or, leaving a timepoint no more than one minute early or five minutes late.
“Leaving” considers OTP from the passengers’ perspective. When passengers want to ride, they don’t care what time the bus arrives or where it comes from. They want to be sure the bus does not leave before the appointed time. When the bus does leave early, they didn’t miss the bus — the bus missed them. Before automation, street supervisors managed OTP in the field, ensuring vehicles didn’t leave early. Now, electronics do the task, but must be programmed. So, here’s the first opportunity to look at your OTP numbers — are you collecting the right data?
Causes of Poor OTP
Analyzing National Transit Database (NTD) data from 1995 until 2017 (the most recent available), we see an 8.4% decrease in Revenue Miles Per Hour, from 13.09 in 1995 to 11.99 in 2017. Concurrently, review of Federal Highway Administration reports shows an increase in congestion. Increased congestion, reduced speed — two sides of the same coin.
Beyond congestion, stop dwell times have increased with increasing use of mobility devices — reflecting the aging population. Factors such as bicycle mounting/dismounting and fare payment delays in some cities affect net bus speeds. If we have not adjusted our routes and schedules in response, we are highly likely to see decreased OTP. Have you considered traffic changes in your city? How have you responded to them?
There are many causes of poor OTP. One example illustrates the difference between statistical reporting and the meaning of the numbers. Many systems operate commuter service, from the “country” to the city in the morning, reversing in the afternoon. Of course, timetables show the morning inbound departure times in the suburb, that’s where we are picking up passengers. Obviously important. They also show downtown arrival times, so riders know what bus should get them to work on time. If, however, actual downtown arrival times are measured for OTP, we are statistically penalizing ourselves for doing a good job — arriving early. Here’s another question then: Are you collecting meaningful data?
Too many timepoints
Another element comes from establishing too many timepoints. Some systems show timepoints as close as one, two, or three minutes apart. During my assessments, I have followed buses that passed these timepoints a minute or two early but were exactly on time further along the route. The operator knew he/she needed the time later, that the allowed running times were incorrect. (In this situation, running times were too generous early in the route). However, each time that occurred, there was a self-inflicted wound, an “early.” In another case, a system assigned a time to each bus stop. With closely spaced stops, the timetable showed buses at two or three places simultaneously, a physical impossibility.
A much better practice is to establish timepoints roughly 10 minutes apart, perhaps a little closer or farther if a major demand generator is involved. Over a 10-minute span, the operator can vary driving style to hit timepoints on time. Passengers can interpolate times at their locations over such a short distance.
Some may consider it cheating to improve the OTP metric by reducing the number of observations. A broken watch is correct twice a day. The contrary thought is that too many timepoints is a disservice to passengers if running times are inaccurate. A by-product is that OTP metrics fall short because we under-value passenger intelligence. Are you using best practices in scheduling?
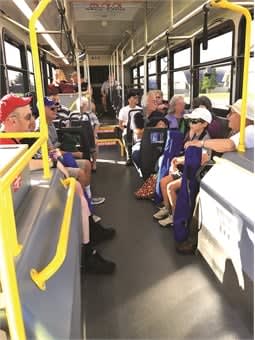
It is reasonable to assume that reliability (on-time performance) is a factor in customer’s modal choice.
Greater Dayton RTA
Clockface headways
Another self-inflicted wound may come from an insistence on using clockface (or clock) headways. A clock headway may see a bus every 60, 30, 20, 15, 12, 10, etc., minutes — the same time past each hour. Also known as a “memory schedule,” the concept is that it’s easy for passengers to remember — thus user-friendly. That only works, though, if the round-trip running time (cycle time) is sustainable.
If an established one-bus route operated reliably on a one-hour cycle time, in 1995 it could operate about 6.5 miles in each direction — outbound for about 26 minutes, inbound for 26 minutes (we’ll discuss recovery time later). Using the NTD data, in 2017 that distance reduces to six miles in each direction, while the cycle time must remain the same. However, we have an added factor in many cities, adding to (not subtracting from) the route. We must extend to the new industrial park, mall, hospital, school. Often, the rubber band has been stretched to meet the two goals — maintain/extend service while retaining the clockface headway. Where does the stretch come from? Most likely, decreased on-time performance.
In evaluating a transit system that operated clock headways, some routes every 60 minutes and every 30 minutes, on paper, route design, congestion, and fare card reloading delays rendered the cycle times unsustainable. Passengers at the system’s hub missed connections. The evaluation of running times showed that a shift to a 70/35-minute headway would be sustainable as a stopgap measure, pending a full-service evaluation. Passenger connections would improve. However, there was a concern about the optics — since this would appear as a service reduction. Are you attempting to put five pounds of sugar in a four-pound bag?
All systems are constrained by funding. Managers and boards must compromise. Coverage with limited resources constrains frequency. Policy frequencies, as seen in a clock headway situation, may constrain the distance that can be covered. Lack of compromise in these two factors results in the third leg of the service triangle falling short — on-time performance. So, a last question, where do you stand on the frequency/coverage/service quality triangle?
In some cities, there is an additional disconnect between finances and achievable schedules. The systems with the “up escalator” and “down escalator” department silos focus on broad numbers, not the effect on individual passengers. Systems which contract service, purchasing operations “by the hour” may penalize the contractor for performance using liquidated damages. There can be a potential conflict of interest if this reduces system expense, but it may divert the reason for low OTP.
To conclude, let’s tie the questions together. Are you setting up for success by reporting meaningful OTP, or are you giving transit opposition an opening to criticize the system’s performance? Are you able to do what you promise the riding public by making those tough compromises or letting quality suffer? If service quality doesn’t reach an acceptable level, are you adequately serving the riding population, or forcing them to other modes?
Arthur N. Gaudet is president of Arthur N. Gaudet & Assoc. Inc. (runcutter@runcutter.com). This article is based on his book, Improving On-Time Performance in the Transit Industry: A Practical Guidebook.
Subscribe to Our Newsletter
More Management
Chicago, Charlotte Transit Agencies Expand Rider Support Programs
CTA launched crisis intervention teams as CATS prepares to deploy fare ambassadors, expanding customer assistance and security efforts across both systems.
Read More →
New York MTA Launches Historic $1.9B Signal, Track Modernization Project
Funded in part by congestion pricing revenue, the project will replace nearly century-old signals along the A and C lines in Brooklyn and Queens.
Read More →
Brian Dickson on Building Stronger, More Resilient Transportation Organizations
Bus Business Consultants Founder Brian Dickson discusses the leadership principles, operational discipline, and strategic planning that separate transportation companies positioned for long-term success from those stuck in survival mode.
Read More →
LA Metro Breaks Ground on Vermont BRT Project
The 12.4-mile corridor is projected to serve 66,200 daily riders, reduce travel times by up to 24%, and create the nation's busiest bus rapid transit corridor.
Read More →
Building Stronger Leaders, More Resilient Transit Teams
Dr. Carol Parker Walsh discusses leadership development, employee retention, workplace culture, and preparing transit’s workforce for AI and automation.
Read More →
Roman Cornell on ABC Companies’ Evolution and the Future of Passenger Transportation
The company’s CEO discusses carrying forward a third-generation family legacy, ABC’s continued evolution in passenger transportation, support for increasingly complex fleets, and how technology and continued investment could help operators improve uptime.
Read More →
CATS Launches West Charlotte Microtransit Zone, Expands Transit Services
The new microtransit zone connects residents to key destinations as Charlotte Area Transit System rolls out the first phase of its 2055 Transit System Plan.
Read More →
VIA Bus Ridership Grows 10.1% Through August 2026
San Antonio's VIA Metropolitan Transit reported the highest bus ridership growth among major Texas transit systems. Federal Transit Administration data ranked it second among the nation's 50 largest transit systems.
Read More →
CSA Group Releases Climate Resilience Standard for Transit, Passenger Rail
Developed with support from the Standards Council of Canada, CSA D700 guides assessing climate-related risks and planning adaptation measures for transit and passenger rail systems.
Read More →
ETA CEO John Maglio on Transit Technology, Innovation, and Building Agency Trust
ETA founder and CEO John Maglio explores the evolution of transit technology, the importance of reliable systems, and how stronger partnerships can help agencies improve operations and the passenger experience.
Read More →