
Calif. could lose $100B in transportation revenue if bill repealed
As an example, in 2040, the mean projection is that the state will collect $8.6 billion with SB1 and $3.4 billion without, a $5.2 billion difference.

The report also reviews the history of raising transportation revenue in California and documents public opinion about different transportation revenue options based on evidence from voting outcomes and public opinion research.

A new report by the Mineta Transportation Institute (MTI) at San José State University explores the consequences if California’s Proposition 6 is passed in November. The proposition would repeal California’s landmark Senate Bill 1 (SB1) — the Road Repair and Accountability Act of 2017.
The study projects that, between now and 2040, California will lose approximately $100 billion in transportation revenue if voters repeal SB1 (see Figure). As an example, in 2040, the mean projection is that the state will collect $8.6 billion with SB1 and $3.4 billion without, a $5.2 billion difference. This has significant consequences for the state’s ability to maintain roads, bridges, and address other transportation improvements.
“California’s ability to plan and deliver an excellent transportation system depends upon the state having a stable, predictable, and adequate revenue stream,” says Martin Wachs, lead author for the report. “Californians have an important decision to make on November 6. A decades-long transportation funding crisis left California’s roads badly in need of costly repair and replacement. Without SB1, where will those funds come from?”

The report’s authors — Wachs, Hannah King, and Asha Weinstein Agrawal — project the amount of transportation revenue that the state’s own taxes will raise through 2040 to support transportation services and infrastructure under two scenarios:
Projected revenue streams under current state laws, including provisions adopted in SB1.
Projected revenue streams should SB1 be repealed by voters in the November 2018 referendum, Proposition 6, on the state ballot.
In addition to projecting total revenues that California will collect under both scenarios, the authors project the cost to Californians who drive by estimating revenue paid per registered vehicle. With SB1 in place, the average revenue collected per vehicle will increase from $265 in 2018 to a maximum of $310 in 2020, and then fall to $190 per vehicle by 2040. Should SB1 be repealed, mean projected revenue per vehicle will drop every year, falling to about $74 in 2040.
The report also reviews the history of raising transportation revenue in California and documents public opinion about different transportation revenue options based on evidence from voting outcomes and public opinion research.
“Whether SB1 is repealed or retained by voters in November 2018, transportation revenue will decrease over time due to inflation and, most importantly, because of dramatic increases in fuel efficiency and the widespread adoption of zero emission vehicles,” notes King. “Of clear importance to the public is assurance that the revenue is being spent efficiently and on things that they care about such as maintenance, safety improvement, and programs that benefit the environment.”
The full report, including data files for the projections, can be downloaded here.
More Management

Modernizing Mobility with CharterUP CEO Armir Harris
From digital transformation to evolving customer demands, CharterUP's Armir Harris offers his perspective on the transportation industry's next chapter.
Read More →
CTTC Enhances Transit Workforce Pipeline Through New Partnerships and Leadership
The group's latest initiatives focus on developing talent, expanding training opportunities and addressing workforce needs across the transit sector.
Read More →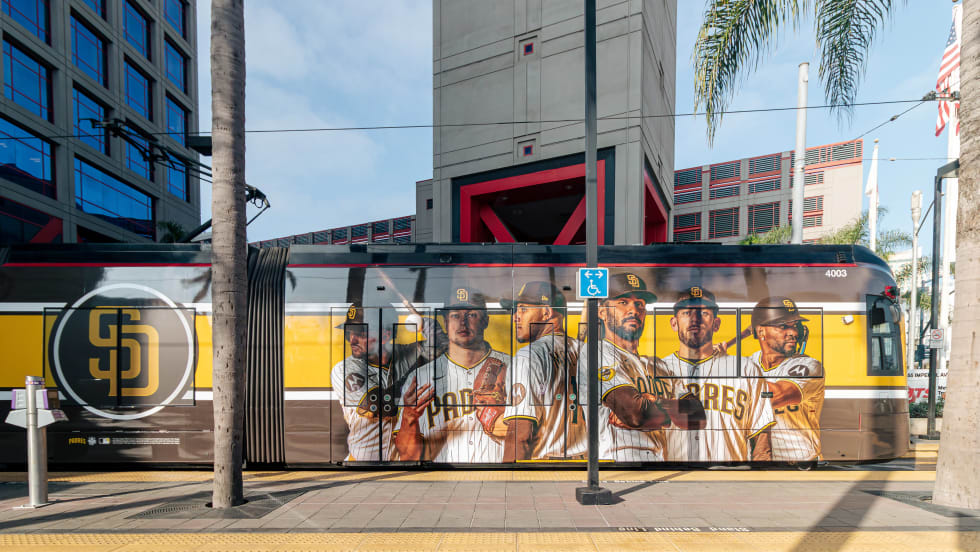
San Diego MTS Keeps Service Intact With New FY 2027 Budget
The approved spending plan avoids route cuts and lays the groundwork for addressing transit funding challenges through the end of the decade.
Read More →
Solving The Driver Shortage: What Transit Agencies Can Learn From the Trucking Industry
See how transit agencies facing persistent driver shortages can learn from the trucking industry’s evolving strategies for recruitment, retention, workplace conditions, and more.
Read More →
FIFA World Cup Matches Are Driving Record Transit Ridership Nationwide
See how World Cup matches are generating record transit demand across North America, with ridership surpassing Super Bowls, concerts, and Olympic-era events.
Read More →
The Hidden Cost of Fuel Data Inaccuracy in Public Transit Fleets
In today's transit environment, accurate fuel and mileage data are critical to reducing costs, minimizing downtime, and improving fleet performance.
Read More →
Virginia's $28.5B Transportation Plan Targets Transit and Rail
Approved by the Commonwealth Transportation Board, the program supports ongoing infrastructure projects while providing new investments in transit, state of good repair and transportation alternatives.
Read More →
Latinos In Transit Seeks Host Organization for 2027 Leadership Summit
The selected host organization will showcase its transit system, projects, and community while welcoming hundreds of industry leaders and emerging professionals during Hispanic Heritage Month.
Read More →
Bipartisan BUSES Act Seeks Changes to New York City's Bus Idling Enforcement Program
Backed by motorcoach operators, the legislation seeks to balance emissions goals with passenger safety by allowing limited idling for inspections, accessibility needs and extreme weather conditions.
Read More →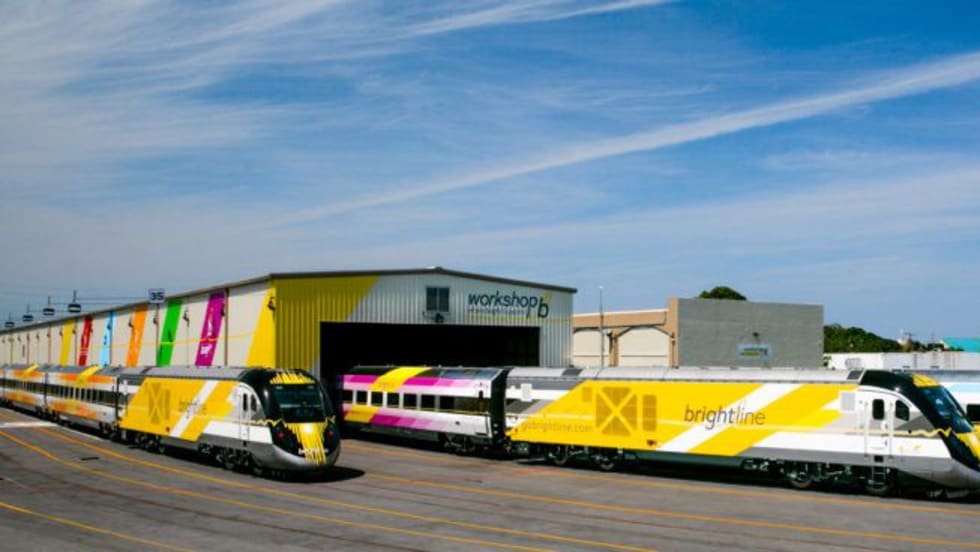
DOT: Brightline Corridor Incidents Fall 30% Following Federal Safety Upgrades
Safety improvements funded through a $25 million federal investment are credited with reducing trespassing and train-vehicle collisions along the Brightline Florida corridor.
Read More →