




Read More: MBTA Launches Online Applications for TAP
MBTA Releases Capital Needs Assessment, Inventory
The Capital Needs Assessment and Inventory (CNAI) is an MBTA-led analysis conducted every three to four years to inventory the MBTA’s assets.
November 17, 2023

The CNAI helps MBTA understand the overall condition of the transit system and identify assets that are not in a State of Good Repair in order to determine the level of investment needed to support the existing network.
Photo: MBTA
4 min to read
The Massachusetts Bay Transportation Authority (MBTA) announced it has released its Capital Needs Assessment and Inventory (CNAI), an MBTA-led analysis conducted every three to four years to inventory the MBTA’s assets, understand the overall condition of the transit system, and identify assets that are not in a State of Good Repair in order to determine the level of investment needed to support the existing network.
“Restoring reliability and ensuring safety are priorities as we rebuild MBTA infrastructure. Understanding and acknowledging the significant resources needed to bring our system to a State of Good Repair is just one step towards fixing our infrastructure to deliver more robust and frequent service. The MBTA is one of the oldest transit agencies in the country, and while there are a number of contributing factors, it’s clear that years of underinvestment have added to the cost of bringing our system back to a state of good repair,” said MBTA GM/CEO Phillip Eng. “Timely and appropriate actions are key to mitigating and avoiding more costly and potentially impactful efforts. Know that we are committed to aggressively addressing our immediate needs – like the recent 16-day outage on the Ashmont Branch to perform track work – as we strive to deliver a modernized system to serve future generations.”
MBTA Estimates
All MBTA assets – facilities, vehicles, infrastructure, and more – have varying expected useful lives and all assets eventually require rehabilitation or replacement on a rolling basis. State of Good Repair (SGR) does not indicate the level of safety but rather is representative of an asset operating at its optimal and expected level of performance. An asset “out of SGR” is more likely to require rehabilitation or replacement, according to the MBTA.
The CNAI is an exercise that helps the MBTA understand the magnitude of asset needs across the system at a single point in time. The SGR Index is calculated as part of the CNAI and aims to capture the baseline condition and estimated value for all assets that have been identified as out of SGR.
The MBTA estimates the current overall SGR Index for assets in need of rehabilitation or replacement to be approximately $24.5 billion. This estimate includes:
Facilities: $6.4 billion (35% of assets)
Rolling Stock: $2.4 billion (55% of assets)
Equipment: $52 million (28% of assets)
Structures: $5.3 billion (22% of assets)
Signals – CR: $1.3 billion (80% of assets)
Signals – Transit: $753 million (53% of assets)
Track – CR: $1.2 billion (9% of assets)
Track – Transit: $2.0 billion (89% of assets)
Power: $5.1 billion (76% of assets)
This estimated figure is an increase of $14.5 billion from the last CNAI performed in 2019 and is driven by a number of factors, including:
A more comprehensive and data-driven inventory approach that significantly increases the total asset count from approximately 59,000 to nearly 83,700. For example, the MBTA’s power asset count significantly increased from 4,959 in 2019 to 14,514 in 2023 because the previous inventory did not include certain cables, overhead catenary, the South Boston power station, emergency generators, or high voltage yards. A more sophisticated inventory of these assets is now included in the 2023 CNAI;
Significant infrastructure and construction cost increases driven by inflation and supply chain challenges;
The continued aging of the MBTA’s assets faster than they are being replaced due to years of underinvestment; and
The length of time for capital investments to show improvements and be reflected in the CNAI. Many capital projects underway now are in varying planning, design, and construction phases. The rehabilitation or replacement of those assets will be reflected in future iterations of the CNAI and SGR Index. Additionally, the cutoff for data to be included in this year’s CNAI was in 2021 and some major investments since that time were not captured in this iteration of the CNAI.
MBTA Addressing Needs
The MBTA is addressing many of the needs identified in the CNAI.
For example, critical track work on the Red Line’s Ashmont Branch and Mattapan Line was successfully completed over the course of a 16-day shuttle bus diversion in late October 2023 in which crews replaced nearly 5,000 feet of rail and 1,174 ties on the Ashmont Branch and nearly 4,700 feet of rail and 1,380 ties on the Mattapan Line, allowing for the removal of all speed restrictions in that area; 83 new bi-level commuter rail coach cars are currently underway to replace the existing fleet and increase system capacity; and Positive Train Control (PTC)implementation continues to advance on the commuter rail signal system.
More Management

Castro to Lead RTC of Southern Nevada and More in People Movement
In this edition, we also cover recent appointments and announcements at the STV, MCI, and more, showcasing the individuals helping to shape the future of transportation.
Read More →
STraffic Expands North American Presence with Fare Collection Technology
John Moon, Associate Director, Product Strategy at STraffic, discusses the company's growth in North America, its efforts to reduce fare evasion, and more.
Read More →
Study: Denver RTD Generates $2.1 Billion in Annual Economic Activity
An economic impact study finds the agency supports approximately 17,500 jobs, delivers $1.6 billion in annual community and mobility benefits, and generates $2.42 in economic value for every dollar invested.
Read More →
Mark Aesch Nominated to Lead Federal Transit Administration
The former Rochester transit chief and TransPro founder, who has also contributed to METRO Magazine, brings decades of industry experience and a focus on performance, accountability, and financial sustainability to the nomination.
Read More →
Best and Worst U.S. Cities for Public Transportation in 2026
A new analysis of 50 major U.S. urban areas ranks public transit systems based on accessibility, affordability, usefulness, and safety, highlighting where transit performs best and where challenges remain.
Read More →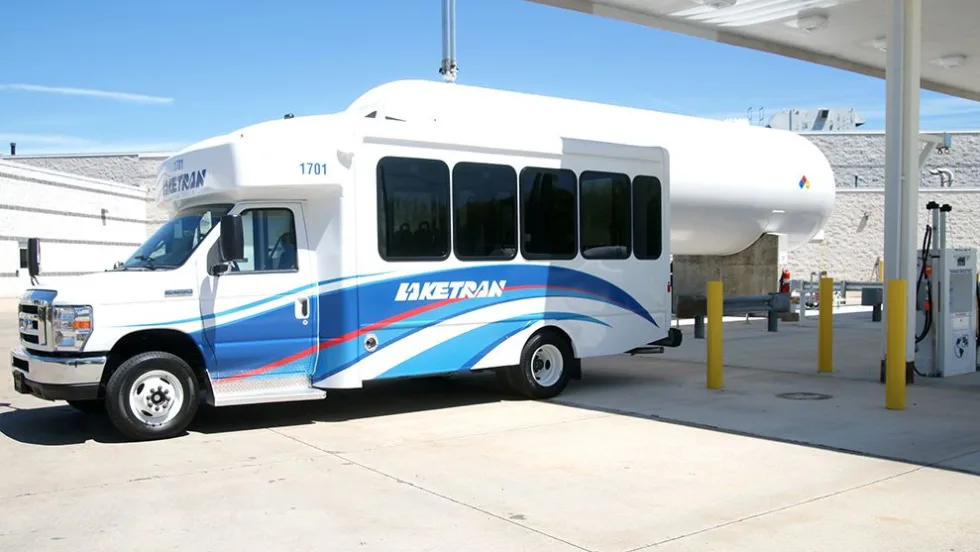
Laketran Cuts Fuel Costs, Boosts Efficiency with Propane-Powered Fleet
The Ohio transit agency is using propane-powered vehicles and on-site fueling infrastructure to cut fuel and maintenance costs while meeting growing demand for paratransit services.
Read More →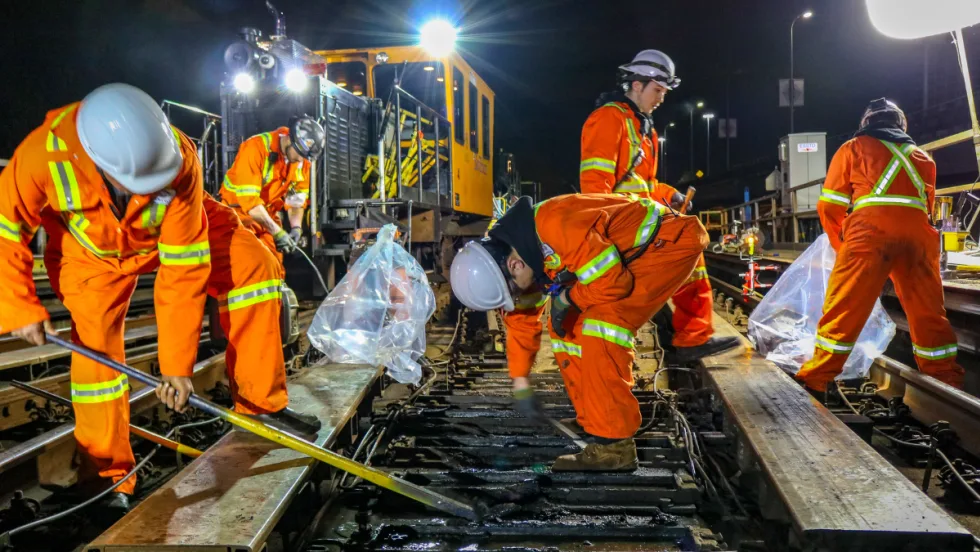
Canada’s Public Transit Supports $65.6 Billion in Annual GDP
New research from the Canadian Chamber of Commerce examines transit's economic contributions, including job creation and the financial implications of transportation investment.
Read More →
Pierce Transit Moves to Expand Fleet Following Proposition 1 Approval
The agency authorized the purchase or refurbishment of up to 60 buses to support a 47% service expansion, as voters nationwide approved billions in new transit funding.
Read More →
Right-Sizing Rural Transit: Lessons from North Grenville’s On-Demand Model
A small municipality shows how flexible service, rider needs, and public accountability can expand mobility with limited resources.
Read More →
Transit Ballot Victories Signal Strong Voter Support: What Comes Next?
Voters approved billions in public transportation investments in 2026, giving agencies opportunities to preserve service, expand operations, and strengthen regional connections amid a changing political landscape.
Read More →