


New study finds parking is the largest cost of driving
Average U.S. driver faced a total driving cost of $10,288 in 2017 made up of direct (i.e. maintenance, fuel) and indirect/hidden (wasted time) costs.

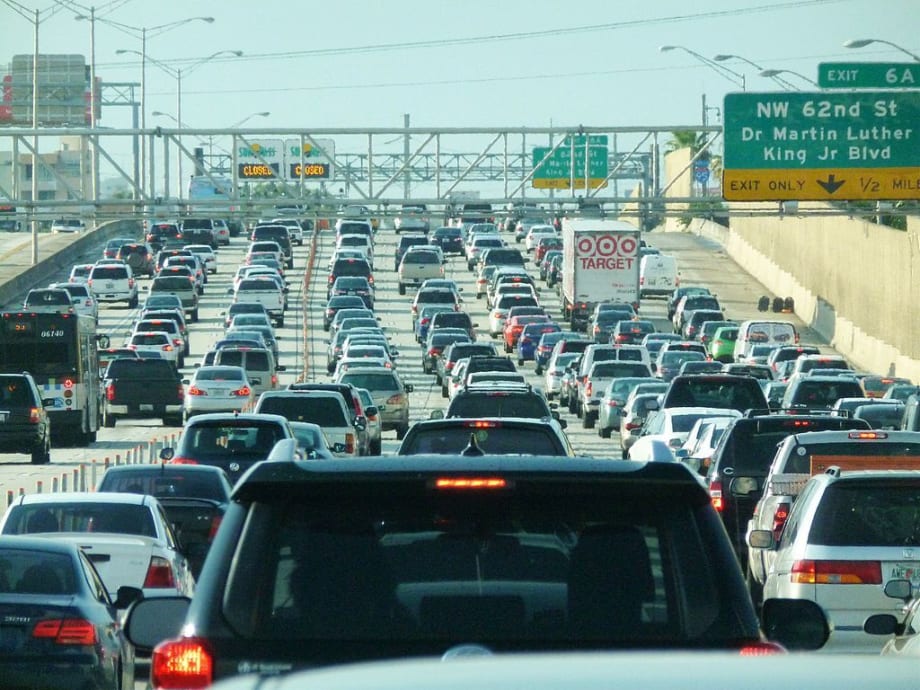
A new study found that the indirect, hidden costs of driving, such as sitting in traffic and searching for parking, carry a significant economic burden for drivers in the U.S. Photo: B137 Wikimedia Commons

A new study found that the indirect, hidden costs of driving, such as sitting in traffic and searching for parking, carry a significant economic burden for drivers in the U.S. Photo: B137 Wikimedia Commons
A new study found that the indirect, hidden costs of driving, such as sitting in traffic and searching for parking, carry a significant economic burden for drivers in the U.S. — to the tune of $3,037 per driver in 2017. The findings of the first-ever "Cost of Driving" study, by INRIX, calculated vehicle ownership costs in 30 major cities in the U.S., UK and Germany.
The average U.S. driver faced a total driving cost of $10,288 in 2017, made up of direct (maintenance, fuel, insurance, and parking and toll fees) and indirect/hidden (wasted time and carbon, parking fines and overpayments) costs. Interestingly, traffic- and parking-related costs made up nearly half (45%) of the total cost of ownership in the U.S.
“The true cost of driving was staggering but what was truly surprising was the size and breakdown of the hidden costs. Parking, for example, made up a third of the total cost of vehicle ownership,” explains Dr. Graham Cookson, chief economist, INRIX. “On average, drivers spent more than $3,000 a year on all parking-related costs.”
INRIX Cost of Driving Index – U.S. City Results
On the local level, New York City was the most expensive city for drivers out of the 30 cities studied. In 2017, the total cost of driving in NYC was nearly two times the national average at $18,926 per driver, mostly due to the cost of parking. New Yorkers parked more often (10 times/week), paid more frequently (60%) and paid the most (average off-street rate of $28 for two hours). At $10,203 per driver, Detroit had the lowest total cost of car ownership mostly due to cheaper on-street and off-street parking rates.
RankCityDirect Costs*Indirect Costs**Total Cost
of DrivingCar OwnershipParkingCongestionParking Pain1 New York City $7,237 $5,395 $2,960 $3,334 $18,926 2 Los Angeles $7,237 $2,405 $2,808 $2,383 $14,834 3 San Francisco $7,237 $2,801 $2,226 $2,361 $14,625 4 Washington D.C. $7,237 $2,170 $2,045 $1,846 $13,297 5 Chicago $7,237 $2,096 $1,982 $1,576 $12,890 6 Boston $7,237 $2,045 $2,075 $1,497 $12,853 7 Seattle $7,237 $1,274 $1,834 $1,504 $11,848 8 Atlanta $7,237 $872 $2,205 $1,264 $11,578 9 Dallas $7,237 $723 $1,671 $1,210 $10,841 10 Detroit $7,237 $815 $1,251 $900 $10,203
INRIX Cost of Driving Index – Country Results
The average U.S. driver faced a total driving cost of $10,288 in 2017, which was 55% more than the average UK driver and 14% more than the average German driver. However, U.S. drivers use their cars more than their German counterparts (13,467 miles driven annually in the U.S. and 8,709 miles driven annually in Germany), but the congestion impact is smaller.
CountryDirect CostsIndirect CostsTotal CostCar OwnershipParkingCongestionParking Painof DrivingU.S. $5,645 $1,607 $1,642 $1,394 $10,288 U.K. $4,260 $1,244 $1,398 $1,337 $8,239 Germany $4,376 $1,062 $2,347 $1,556 $9,341
Thankfully, there are solutions to alleviate some of these costs through awareness and technology. Applying big data to create intelligent connected car services is key to solving mobility problems, which will reduce the economic impact of congestion and parking pain.
The direct Cost of Driving includes parking and car ownership charges. INRIX Research calculated car ownership costs by multiplying the annual mileage travelled from the U.S. Federal Highway Administration (FHWA) by the IRS stated mileage rates that can be reclaimed when using a vehicle for business purposes — $0.537 in 2017. This figure is updated annually and is designed to reflect the average cost of running a vehicle in the U.S. Multiplying this by the average annual mileage provided by the FHWA provided an estimate of the annual cost of running a car.
Car ownership costs include:
Purchasing or leasing a vehicle including finance costs
Depreciation in the value of the vehicle
Maintenance and servicing including tires
Insurance
Fuel
Parking and toll fees
Taxes
** The indirect Cost of Driving includes the cost of congestion and ‘Parking Pain’:
Time, fuel and value of carbon emissions generated by sitting in congestion
Time, fuel and value of carbon emissions generated by searching for parking
Overpaying for parking (e.g. putting 2 hours in when you need 30 minutes)
Parking fines
More New Mobility

From Hardware to Digital Partner: Luminator Charts Its Next Chapter
CEO Magnus Friberg discusses Luminator’s shift toward becoming a digital partner, the growing importance of software and interoperability, and how AI can help agencies improve operations and passenger experience.
Read More →
Biz Briefs: Alstom Lands Canadian Contract, LYT to Supply California TSP, and More
In METRO's latest installment, we take a look at recent news from Complete Coach Works, Beep, FlixBus, and more partnerships making headlines across the transportation sector.
Read More →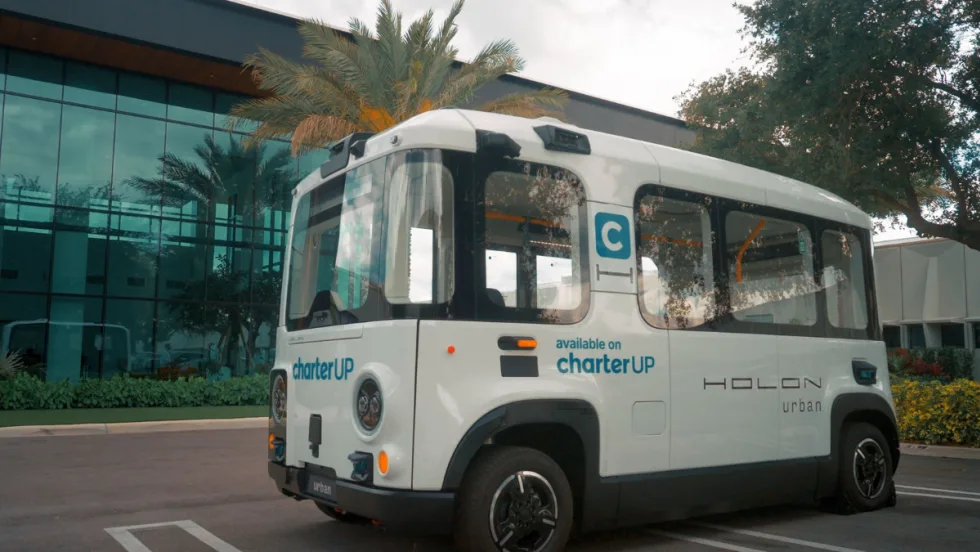
CharterUP’s Armir Harris on Technology, AI, and the Future of Group Mobility
In a recent episode of METROspectives, CharterUP Founder/CEO Armir Harris discussed the company’s evolution from an online charter bus marketplace into a technology platform supporting public- and private-sector mobility and much more.
Read More →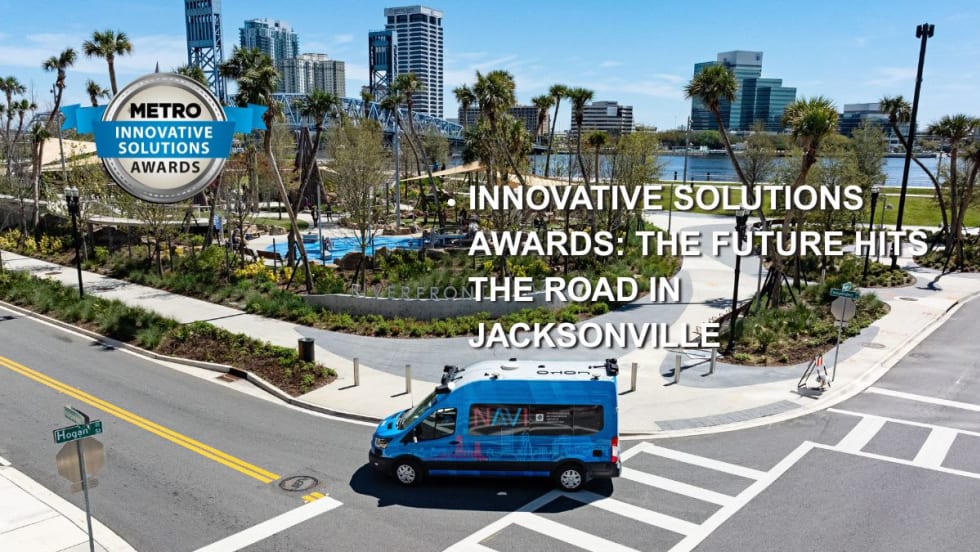
Jacksonville’s NAVI Project Charts a New Course for Autonomous Public Transportation
Through its NAVI program, JTA is showing how autonomous vehicles, intelligent infrastructure, and coordinated operations can work together to deliver everyday public transportation.
Read More →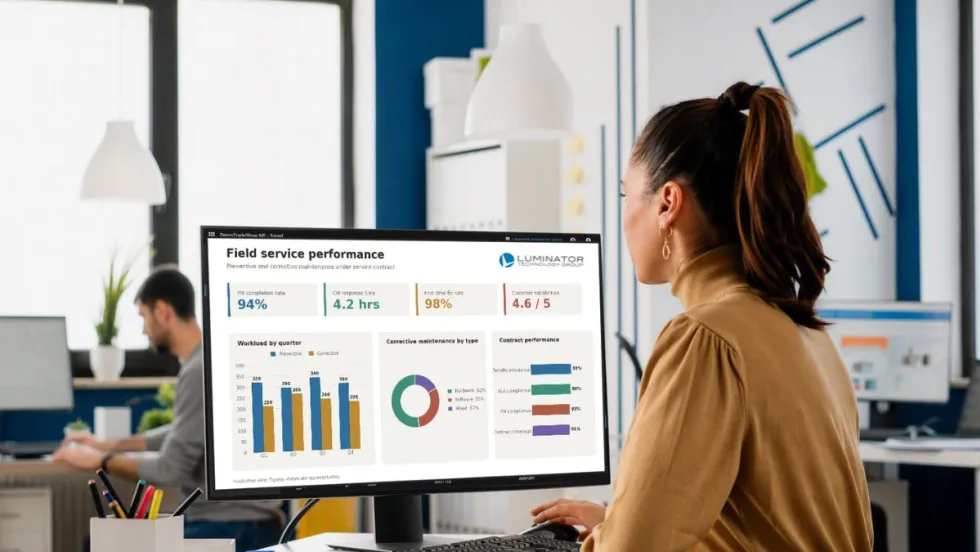
Biz Briefs: Luminator Marks Milestone and More
From manufacturers and suppliers to transit agencies and motorcoach operators, these updates offer a snapshot of the projects, partnerships and business moves driving the industry forward.
Read More →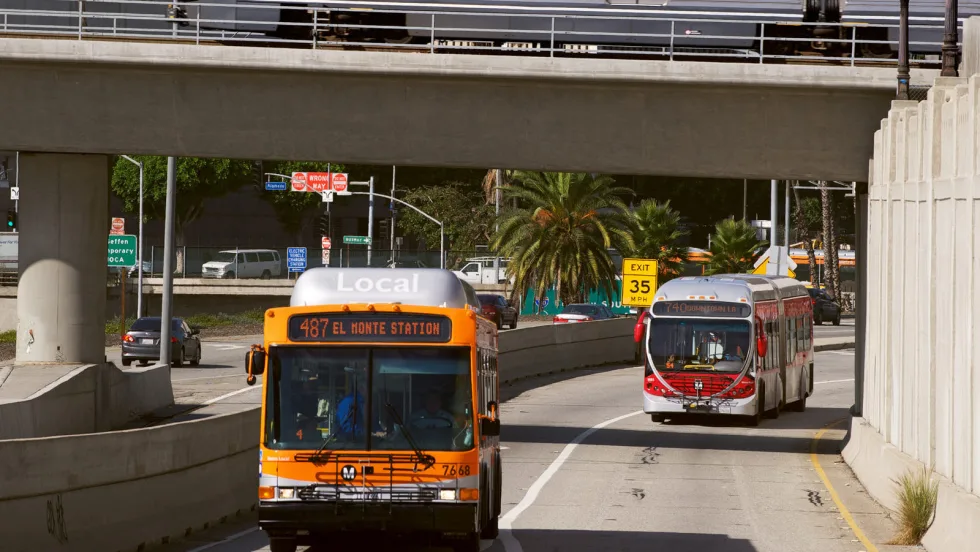
New Tricks for Old Bureaucracies: Joshua Schank on Making Transit Innovation Stick
Former LA Metro Chief Innovation Officer Joshua Schank discusses why good ideas aren't enough, how transit agencies can overcome resistance to change, and why today's challenges demand more innovation.
Read More →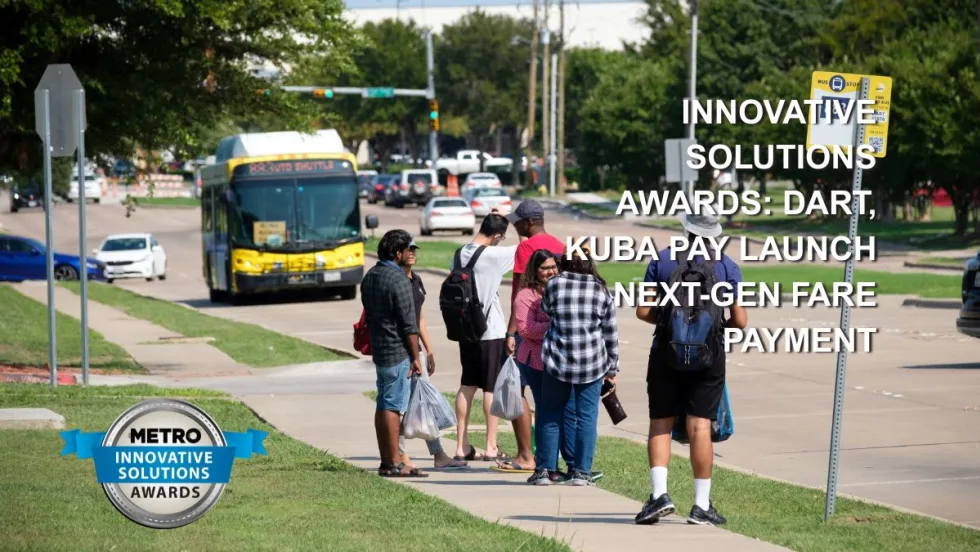
How DART's GoPass Is Redefining Regional Mobility
Serving 14 transit agencies, GoPass simplifies multimodal travel by allowing riders to plan, pay for, and manage an entire trip through one app.
Read More →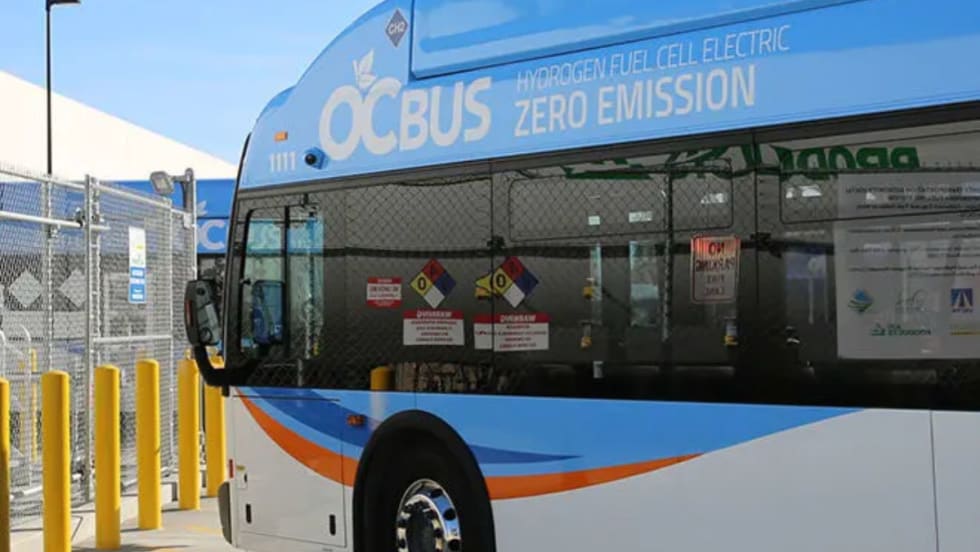
Biz Briefs: OCTA Taps Clean Energy for Hydrogen Station, Stadler to Supply Via Rail Vehicles, and More
From manufacturers and suppliers to transit agencies and motorcoach operators, these updates offer a snapshot of the projects, partnerships and business moves driving the industry forward.
Read More →CharterUP Expands Into New Mobility and Autonomous Transportation
Vice President of New Mobility Stephen Joos discusses how CharterUP is leveraging its nationwide transportation network, technology platform, and autonomous vehicle partnerships to expand into workforce mobility, campus shuttles, and transit solutions.
Read More →
METRO Magazine Announces 2026 Innovative Solutions Awards Winners
Projects Recognized for Advancing Mobility Through Technology, Accessibility, Workforce Innovation, and Operational Excellence
Read More →