

“Compared to other industries, the public transit sector faces some of the greatest exposure to the general public. These concerns are boosting safety to the top of the priority list for many transit organizations.”
Public transit sees increase in liability claim severity, study says
Study participants rank third-party liability as top risk facing the transit industry.
December 11, 2018
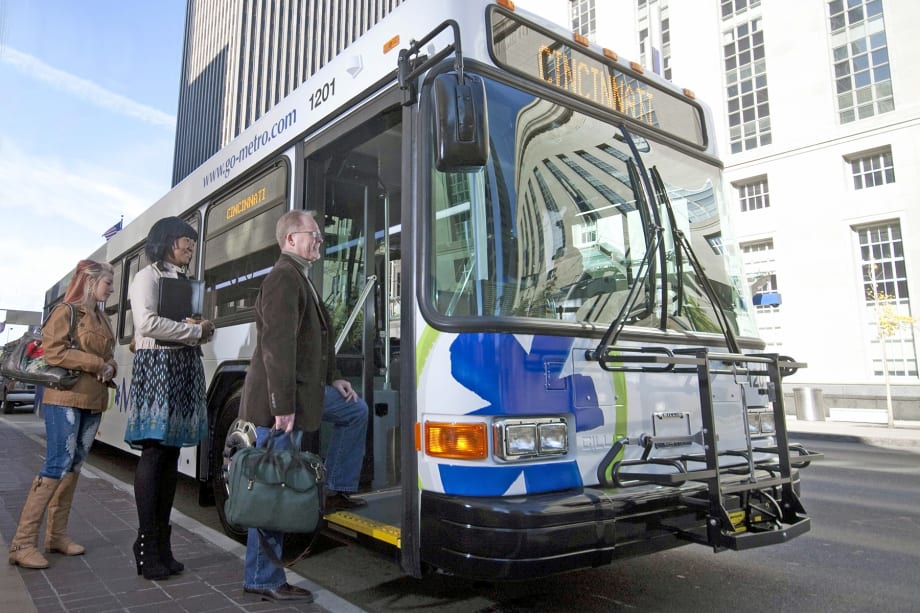
Compared to other industries, the public transit sector faces some of the greatest exposure to the general public. Photo: SORTA
2 min to read

Nationwide, public transit systems are seeing an increase in liability claim severity according to a new report. This inaugural Aon Public Transit Liability Benchmark Analysis, which examines ridership and operation claims for rail and bus transit agencies, was conducted in conjunction with the American Public Transportation Association.
While public transit liability claim severity is up 4% annually, claim frequency showed an increase of only .5% annually. The report breaks down the data, finding that the frequency of bus claims is higher than that of rail claims, while the severity of rail claims is higher than that of bus claims. This is due in part to the fact that buses interact with pedestrians and other road traffic, leaving greater potential for incidents leading to liability claims. The study also found that vehicle-on-pedestrian claims account for 3% of claims, but nearly 40% of incurred loss dollars.
“Compared to other industries, the public transit sector faces some of the greatest exposure to the general public. These concerns are boosting safety to the top of the priority list for many transit organizations,” said Otis Tolbert, rail and transit practice leader for Aon Risk Solutions.
Other statistics from the analysis include:
The forecasted 2016 accident year frequency for bus and rail operations combined is .34% per 1,000 riders, or one occurrence per 295,879 riders.
The forecasted 2016 accident year loss rate for bus and rail operations combined is $39.17 per 1,000 riders, or 3.9 cents per rider.
Approximately 72% of the claims arose from automobile accidents, with 91% of those claims stemming from vehicle on vehicle accidents. Of the claims that did not arise from automobile accidents, approximately 32% arose from passengers falling.
More Management
Sponsored•August 2, 2026
Turn Transit Data Into Action
Discover how leading agencies are using connected technology to gain real-time visibility across operations, improve service reliability, and reduce disruptions.
Read More →
What Transit-Oriented Development Means for the Future of Public Transportation
Once viewed primarily as transit operators, agencies are now leveraging land, partnerships, and long-term planning to boost ridership, expand housing, and strengthen communities.
Read More →
USDOT Announces $22 Million for Transit Innovation, Updates High-Speed Rail Rules
New federal transit funding will support safety, accessibility, and technology projects as updated rail regulations establish new noise standards for high-speed trains.
Read More →
Transportation Construction Coalition Unveils Infrastructure Case Studies Ahead of Federal Funding Deadline
The coalition noted the next surface transportation bill should provide sustained investment in highways and public transit to strengthen freight movement, improve safety, and support economic growth.
Read More →
People Movement: American Bus Association Extends Ferguson and More
METRO’s People Movement highlights the latest leadership changes, promotions, and personnel news across the public transit, motorcoach, and people mobility sectors.
Read More →
METRO Magazine Announces 2026 Innovative Solutions Awards Winners
Projects Recognized for Advancing Mobility Through Technology, Accessibility, Workforce Innovation, and Operational Excellence
Read More →
MBTA Rolls Out Pilot Programs to Cut Costs, Simplify Travel
Three new fare pilots — including unlimited two-hour transfers, reduced express bus fares, and free transit for eligible seniors — will launch this fall as Massachusetts extends popular commuter rail discounts through November.
Read More →
FTA Opens $610 Million Funding Opportunity for Bus Infrastructure Projects
The latest Notice of Funding Opportunity provides transit agencies with funding for bus facilities, fleet modernization, and low- and no-emission vehicles, with applications due September 21.
Read More →Biz Briefs: STV teams with Amtrak, Motorcoach Operators Boost Fleet and Land Contracts, and More
From manufacturers and suppliers to transit agencies and motorcoach operators, these updates offer a snapshot of the projects, partnerships and business moves driving the industry forward.
Read More →
Massachusetts Approves $530M to Strengthen MBTA Operations, Infrastructure
The funding package targets operating stability, capital improvements, and fare affordability, offering a model for agencies navigating long-term funding challenges.
Read More →