

RELATED: LA Mayor creates zero-emissions mobility pilot fund
Report helps determine how much transit reduces pollution emissions
Researchers used tap-on tap-off rider data to quantify the emissions saved by buses and commuter rail lines.
August 27, 2019
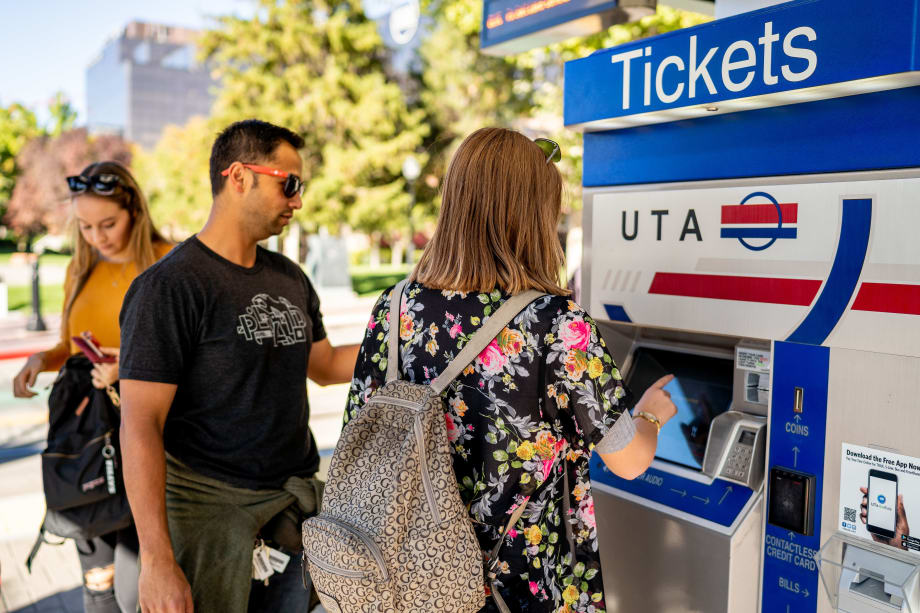
Approximately half of Utah Transit Authority passengers use an electronic fare medium.
University of Utah
3 min to read

With the use of better rider tracking tools, a new report from the University of Utah and the Utah Transit Authority can better answer the question: How much does public transit reduce pollution emissions?
Researchers used tap-on tap-off rider data to quantify the emissions saved by buses and commuter rail lines, and also project how much additional emissions could be saved by upgrading the bus and rail fleet.
High-resolution rider data
A couple of recent technological advances have enabled University of Utah researchers Daniel Mendoza, Martin Buchert and John Lin to answer the question with a level of detail previously unparalleled.
The first is the advance of tap-on tap-off farecards that provide anonymized data on where those riders who have electronic passes enter and exit public transit. Approximately half of UTA’s passengers use an electronic fare medium. “Now we can truly quantify trips in both time and space,” Mendoza says. “We accounted for all of the 2016 passenger miles by scaling the farecard data, and we know which trips farecard holders make on buses, light rail and commuter rail.”
The second is the General Transit Feed Specification system. It’s the data source that supplies Google Maps with transit information to help users find the bus or train they need. With that data source, the researchers could track where and how often UTA’s buses and trains run.
So, with high-resolution data on the movement of both vehicles and passengers, the researchers could paint a nearly comprehensive picture of public transit along the Wasatch Front.
Balancing emissions
So, with that data, the researchers could quantify the emissions produced and miles traveled of the transit systems (TRAX light rail uses electricity produced outside the Wasatch Front, hence the emissions aren’t in Salt Lake’s air) and balance that with the miles traveled by passengers and the estimated amount of car travel avoided by riding transit.
On weekdays during rush hours, and in densely populated areas, the balance was clearly on the side of reduced emissions. “That tapers off significantly during the evening hours, on the outskirts of the city, and definitely during the weekends,” Mendoza says. In those situations, the number of passengers and how far they rode transit did not offset certain criteria pollutant emissions. (Criteria pollutants are six common air pollutants that the EPA sets standards for through the Clean Air Act.)
For transit to improve its regional reduction in emissions, particularly PM2.5 and NOx, the following strategies, alone or in combination, could be employed: more daily riders per trip, more clean-fuel buses and train cars and/or fewer low-ridership trips.
What-ifs
The current study looks at the bus and train fleet as they are now, with some UTA buses around 20 years old and FrontRunner trains whose engines are rated a Tier 0+ on a 0-4 scale of how clean a locomotive’s emissions are (Tier 4 is the cleanest; UTA is scheduled to receive funds programmed through the Metropolitan Planning Organizations to upgrade FrontRunner locomotives to Tier 2+). So, Mendoza and his colleagues envisioned the future.
“What if we upgrade all these buses, some of them from 1996 or so?” Mendoza says. “They emit a significantly larger amount than the newer buses, which are 2013 and newer.”
What if, they asked, UTA upgraded their buses to only 2010 models and newer, fueled by either natural gas or clean diesel? And what if the FrontRunner engines were upgraded to Tier 3?
Emissions of some pollutants would drop by 50%, and some by up to 75%, they found.
“Now, with this information, UTA can go to stakeholders and funding agencies and say, ‘Look, we’ve done this analysis,” Mendoza says. “This is how much less we can pollute.’”
The study was conducted in cooperation with the Utah Transit Authority and the Utah Department of Environmental Quality, Division of Air Quality.
More Management
Sponsored•August 2, 2026
Turn Transit Data Into Action
Discover how leading agencies are using connected technology to gain real-time visibility across operations, improve service reliability, and reduce disruptions.
Read More →
What Transit-Oriented Development Means for the Future of Public Transportation
Once viewed primarily as transit operators, agencies are now leveraging land, partnerships, and long-term planning to boost ridership, expand housing, and strengthen communities.
Read More →
USDOT Announces $22 Million for Transit Innovation, Updates High-Speed Rail Rules
New federal transit funding will support safety, accessibility, and technology projects as updated rail regulations establish new noise standards for high-speed trains.
Read More →
Transportation Construction Coalition Unveils Infrastructure Case Studies Ahead of Federal Funding Deadline
The coalition noted the next surface transportation bill should provide sustained investment in highways and public transit to strengthen freight movement, improve safety, and support economic growth.
Read More →
People Movement: American Bus Association Extends Ferguson and More
METRO’s People Movement highlights the latest leadership changes, promotions, and personnel news across the public transit, motorcoach, and people mobility sectors.
Read More →
METRO Magazine Announces 2026 Innovative Solutions Awards Winners
Projects Recognized for Advancing Mobility Through Technology, Accessibility, Workforce Innovation, and Operational Excellence
Read More →
MBTA Rolls Out Pilot Programs to Cut Costs, Simplify Travel
Three new fare pilots — including unlimited two-hour transfers, reduced express bus fares, and free transit for eligible seniors — will launch this fall as Massachusetts extends popular commuter rail discounts through November.
Read More →
FTA Opens $610 Million Funding Opportunity for Bus Infrastructure Projects
The latest Notice of Funding Opportunity provides transit agencies with funding for bus facilities, fleet modernization, and low- and no-emission vehicles, with applications due September 21.
Read More →Biz Briefs: STV teams with Amtrak, Motorcoach Operators Boost Fleet and Land Contracts, and More
From manufacturers and suppliers to transit agencies and motorcoach operators, these updates offer a snapshot of the projects, partnerships and business moves driving the industry forward.
Read More →
Massachusetts Approves $530M to Strengthen MBTA Operations, Infrastructure
The funding package targets operating stability, capital improvements, and fare affordability, offering a model for agencies navigating long-term funding challenges.
Read More →