
Study Reveals Most Dangerous States to Use Public Transportation
High Rise Legal Funding analyzed bus fatality data from 2010-2022 from the Bureau of Transport Statistics as well as rail accident data for 2022 from the Federal Railroad Administration for its latest study.

The total number of bus fatalities and rail accidents were compared against the population of each state to find the number of public transport-related accidents per 100,000 residents.
Photo: Canva
According to new research from a study by High Rise Legal Funding, Montana is the most dangerous state for using public transportation.
High Rise Legal Funding analyzed bus fatality data from 2010-2022 from the Bureau of Transport Statistics as well as rail accident data for 2022 from the Federal Railroad Administration for its latest study.
The total number of bus fatalities and rail accidents were compared against the population of each state to find the number of public transport-related accidents per 100,000 residents.
All 50 states were given a "Public Transport Safety Score" out of 100 on this basis.
Where do the States Rank?
Index Ranking | State | Population | 2022 Train Accident Numbers | 2010-2020 Bus Accidents | Train Accidents per 100,000 people | Bus Accidents per 100,000 people | Public Transport Safety Score |
|---|---|---|---|---|---|---|---|
1 | Montana | 1,139,507 | 20 | 5 | 1.76 | 0.44 | 12.81 |
2 | New Mexico | 2,110,011 | 20 | 14 | 0.95 | 0.66 | 12.90 |
3 | North Dakota | 780,588 | 16 | 3 | 2.05 | 0.38 | 13.12 |
4 | Arkansas | 3,063,152 | 81 | 9 | 2.64 | 0.29 | 14.25 |
5 | Nebraska | 1,972,292 | 91 | 3 | 4.61 | 0.15 | 17.56 |
6 | Mississippi | 2,930,528 | 28 | 12 | 0.96 | 0.41 | 18.59 |
7 | Tennessee | 7,134,327 | 85 | 20 | 1.19 | 0.28 | 21.30 |
8 | Kansas | 2,936,378 | 89 | 4 | 3.03 | 0.14 | 22.30 |
9 | Texas | 30,500,280 | 307 | 70 | 1.01 | 0.23 | 25.06 |
10 | Alabama | 5,098,746 | 78 | 8 | 1.53 | 0.16 | 26.18 |
Montana ranks as the most dangerous state for using public transport in America, with a Public Transport Safety Score of 12.81 out of 100.
Montana had the largest number of public transport accidents per 100,000 residents compared to every other US state. The state had 1.76 rail accidents per 100,000 residents which is 183% above the national average of 0.96 rail accidents per 100,000 people. It also recorded 0.44 bus fatalities per 100,000 residents.
Scoring 12.90 out of 100, New Mexico is the second most dangerous state to use public transport. The state recorded 20 rail accidents in 2022, and 14 bus fatalities between 2010 and 2020.
In third place is North Dakota with a score of 13.12 out of 100. The state recorded 16 rail accidents and three bus fatalities in the review period. However, due to its smaller population size, this resulted in a higher number of public transport accidents per 100,000 residents than other states with relatively higher numbers of accidents in the same period.
Arkansas ranks as the fourth most dangerous state in which to use public transport in America. The state recorded 81 rail accidents throughout 2022 and nine bus fatalities between 2010 and 2022, earning it a Public Transport Safety Score of 14.25 out of 100.
Nebraska was found to be the fifth most dangerous state to use public transport, with a Public Transport Safety Score of 17.56 out of 100.
Scoring 18.59 out of 100, Mississippi ranks as the sixth most dangerous state for public transport usage. The state recorded 28 rail accidents and 12 bus fatalities in the period under review.
Tennessee ranks seventh, with a Public Transport Safety Score score of 21.30 while Kansas ranks eighth, scoring 22.30 out of 100. Kansas recorded 89 rail accidents in 2022 and four bus fatalities between 2010 and 2020.
Coming in ninth place is Texas, with a score of 25.06 out of 100,
Texas had the highest total number of bus and train accidents, with 377 combined bus and train accidents. However, due to its size, this worked out to 1.24 bus and train accidents per 100,000 residents.
Alabama is the 10th most dangerous state to use public transport. With 78 rail accidents in 2022 and eight bus fatalities between 2010 and 2022, the state has a safety score of 26.18 out of 100.
Safest States for Public Transportation
The results found that New Hampshire ranks as the safest state for using public transport in America with a Public Transport Safety Score of 100 out of 100.
New Hampshire recorded zero bus fatalities between 2010 and 2020, as well as zero rail accidents throughout 2022.
The Granite State also ranks well in other safety indices, recording some of the lowest rates of pedestrian deaths, violent crime, and property crime per 100,000 residents of all 50 states.
The safest states include:
New Hampshire
Hawaii
Rhode Island
Maine
Vermont
West Virginia
South Dakota
Massachusetts
Wyoming
Ohio
More Security and Safety
APTA Recognizes Excellence in Rail Safety and Security at 2026 Rail Conference
Nominations are evaluated on four criteria: effectiveness, benefit level, innovation, and transferability.
Read More →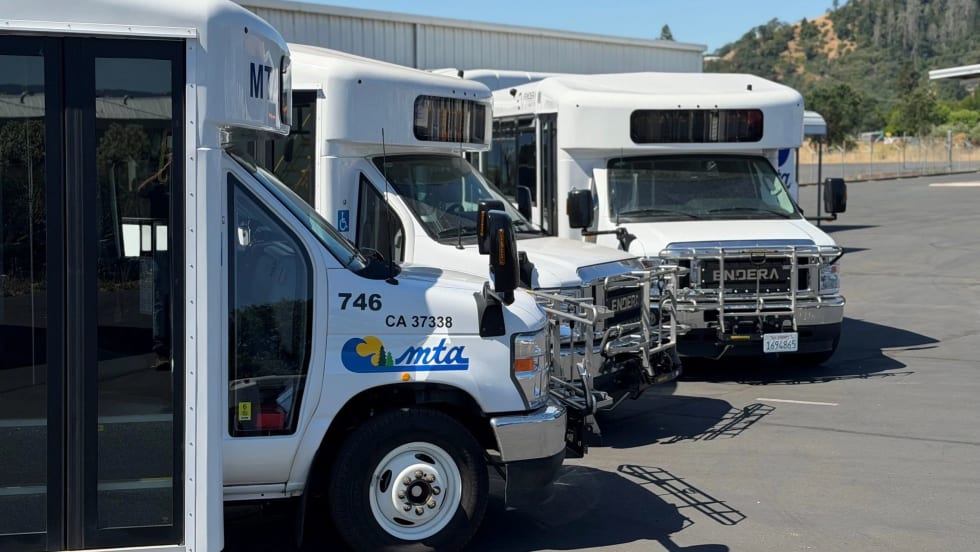
Biz Briefs: Endera Delivers to California, Safety Vision Teams with San Antonio's VIA, and More
From manufacturers and suppliers to transit agencies and motorcoach operators, these updates offer a snapshot of the projects, partnerships and business moves driving the industry forward.
Read More →
The Role of AI in Public Safety for Smart Transit Systems
As transit systems generate more data than ever, AI-powered safety tools are helping agencies detect incidents faster, improve response times and enhance situational awareness.
Read More →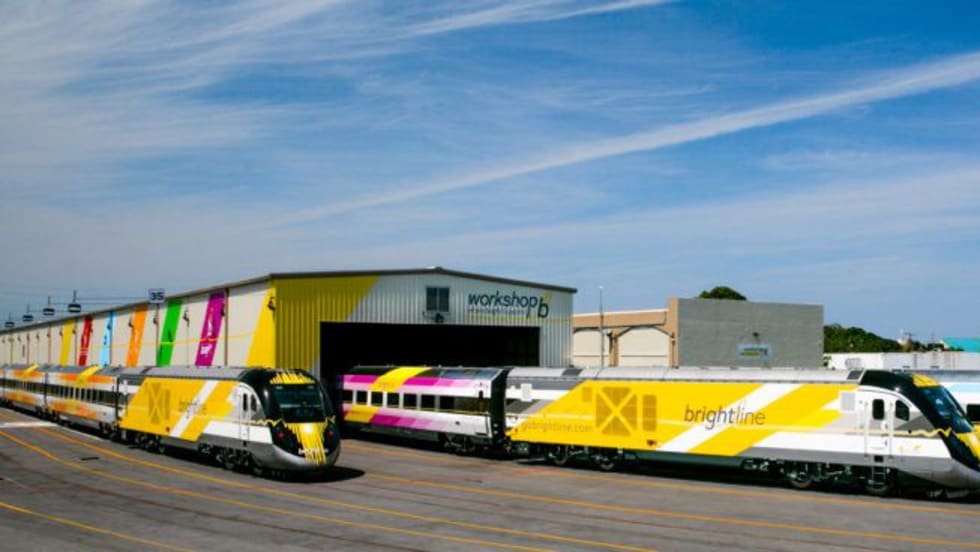
DOT: Brightline Corridor Incidents Fall 30% Following Federal Safety Upgrades
Safety improvements funded through a $25 million federal investment are credited with reducing trespassing and train-vehicle collisions along the Brightline Florida corridor.
Read More →
LA Metro Sworn Officer Recruitment Draws 950 Applications on First Day
The California agency moves safety into its next phase, recruiting officers to help shape a transit-focused, community-centered force.
Read More →
FTA Plans Family-Friendly Transit Scorecard for Agencies Nationwide
The family-friendly transit dashboard is part of a broader effort by the FTA and U.S. Department of Transportation to increase transparency, accountability, and service quality across the nation's public transportation systems, said officials.
Read More →
New Public Safety Hub Opens in Downtown Houston
The substation strengthens METRO Police presence in an area where transit activity, pedestrian movement, and visitor flow converge.
Read More →
SamTrans Sets Priorities for Potential Connect Bay Area Revenue
The board-approved framework allocates future funding to maintaining service, rider improvements, equity initiatives, and infrastructure repairs.
Read More →
Federal Transit Officials Launch MARTA Safety Probe
FTA has given MARTA 15 days to provide records on crime prevention, fare evasion enforcement, and security funding as part of a broader safety investigation.
Read More →
Strategic Safety Measures at CATS Lead to Drop in Transit Crime
Under the leadership of the CATS Chief Safety and Security Officer, the organization has marked a pivotal transformation.
Read More →