
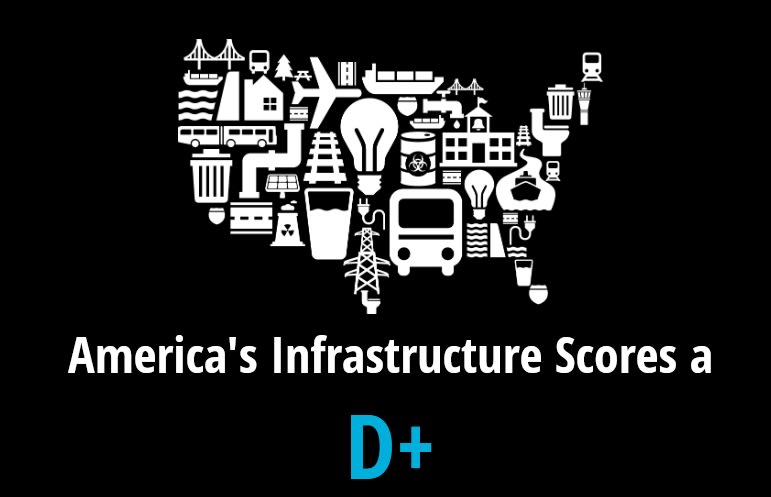
U.S. infrastructure receives near failing grade again
ASCE evaluated 16 categories of infrastructure in the 2017 Report Card, with grades ranging from a “B” for Rail to a “D-” for Transit.

Screenshot via ASCE

The American Society of Civil Engineers (ASCE) released its 2017 Infrastructure Report Card, the quadrennial assessment of the nation’s infrastructure. The 2017 Report Card found the national grade for infrastructure remains at a “D+” — the same grade the U.S. received in 2013 — suggesting only incremental progress was made over the last four years toward restoring America’s infrastructure.
ASCE evaluated 16 categories of infrastructure in the 2017 Report Card, with grades ranging from a “B” for Rail to a “D-” for Transit. While the overall grade did not improve, seven categories did see progress. These improvements can be attributed to strong leadership, thoughtful policymaking, and investments that garnered measurable results.
“While our nation’s infrastructure problems are significant, they are solvable,” said ASCE President Dr. Norma Jean Mattei, P.E. “We need our elected leaders — those who pledged to rebuild our infrastructure while on the campaign trail — to follow through on those promises with investment and innovative solutions that will ensure our infrastructure is built for the future.”
ASCE recommends the following solutions to raise the grades:
Sustained infrastructure investment, increasing investment from all levels of government and the private sector from 2.5% to 3.5% of U.S. Gross Domestic Product (GDP) by 2025;
Bold leadership from officials at all levels of government and the private sector to ensure that investment is spent wisely, including planning for the costs of building, operating, and maintaining the infrastructure for its entire lifespan; and
Preparation for the needs of the future, to ensure infrastructure is more resilient and sustainable, with clear economic, social, and environmental benefits.
The 2017 Report Card also highlights the projected total investment required to bring current infrastructure to a grade of a “B” — what ASCE considers to be an adequate grade. ASCE estimates that by 2025 a total investment of $4.59 trillion is required to improve the nation’s infrastructure. After projecting current funding levels, the estimated funding shortfall totals slightly more than $2 trillion. If the U.S. continues on this trajectory and fails to invest, the nation will face serious economic consequences, including $3.9 trillion in losses to U.S. GDP and more than 2.5 million American jobs lost in 2025, according to ASCE officials.
“Our infrastructure bill is overdue and our inaction is costing American's $3400 per year in lost disposal income,” said Greg DiLoreto, P.E., a past ASCE president and the current chair of the ASCE Committee on America’s Infrastructure, which prepared the Report Card. “While Congress and states have made some effort to improve infrastructure, it’s not enough. To see real progress, we need to make long-term infrastructure investment a priority. Investing now will create economic opportunity, enhance quality of life, and ensure public health and safety.”
About the ASCE Report Card
Using a simple A to F school report card format, ASCE’s Infrastructure Report Card provides a comprehensive assessment of current infrastructure conditions and needs, assigning grades and making recommendations to raise them. The ASCE Committee on America’s Infrastructure, made up of dedicated civil engineers from across the country with decades of expertise in all categories, prepares the Report Card, assessing all relevant data and reports, consulting with technical and industry experts, and assigning grades using the following criteria: capacity, condition, funding, future need, operation and maintenance, public safety, resilience, and innovation. Since 1998, the grades have been near failing, averaging only Ds, due to delayed maintenance and underinvestment across most categories.
In addition to the national Report Card, ASCE’s sections and branches prepare state and regional Infrastructure Report Cards on a rolling basis.
More Management
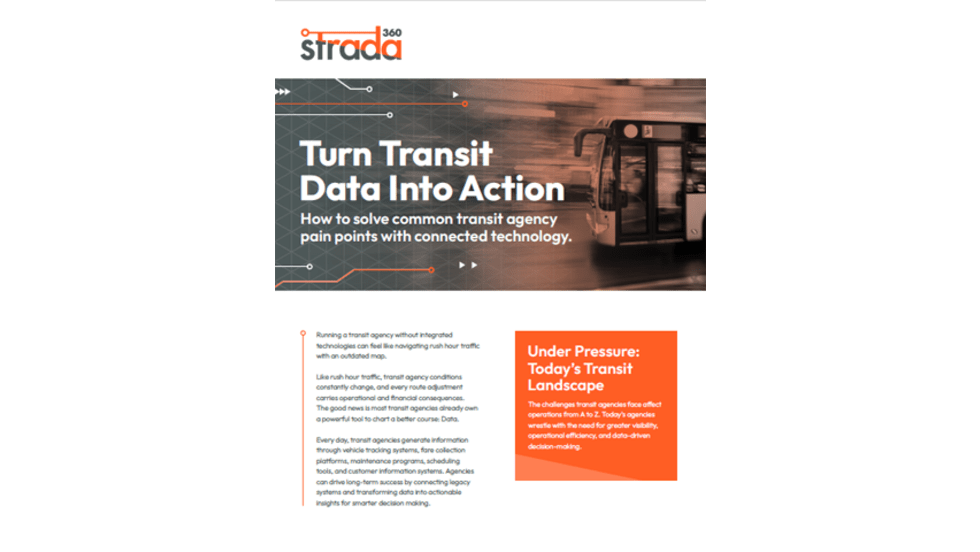
Turn Transit Data Into Action
Discover how leading agencies are using connected technology to gain real-time visibility across operations, improve service reliability, and reduce disruptions.
Read More →
What Transit-Oriented Development Means for the Future of Public Transportation
Once viewed primarily as transit operators, agencies are now leveraging land, partnerships, and long-term planning to boost ridership, expand housing, and strengthen communities.
Read More →
USDOT Announces $22 Million for Transit Innovation, Updates High-Speed Rail Rules
New federal transit funding will support safety, accessibility, and technology projects as updated rail regulations establish new noise standards for high-speed trains.
Read More →
Transportation Construction Coalition Unveils Infrastructure Case Studies Ahead of Federal Funding Deadline
The coalition noted the next surface transportation bill should provide sustained investment in highways and public transit to strengthen freight movement, improve safety, and support economic growth.
Read More →
People Movement: American Bus Association Extends Ferguson and More
METRO’s People Movement highlights the latest leadership changes, promotions, and personnel news across the public transit, motorcoach, and people mobility sectors.
Read More →
METRO Magazine Announces 2026 Innovative Solutions Awards Winners
Projects Recognized for Advancing Mobility Through Technology, Accessibility, Workforce Innovation, and Operational Excellence
Read More →
MBTA Rolls Out Pilot Programs to Cut Costs, Simplify Travel
Three new fare pilots — including unlimited two-hour transfers, reduced express bus fares, and free transit for eligible seniors — will launch this fall as Massachusetts extends popular commuter rail discounts through November.
Read More →
FTA Opens $610 Million Funding Opportunity for Bus Infrastructure Projects
The latest Notice of Funding Opportunity provides transit agencies with funding for bus facilities, fleet modernization, and low- and no-emission vehicles, with applications due September 21.
Read More →Biz Briefs: STV teams with Amtrak, Motorcoach Operators Boost Fleet and Land Contracts, and More
From manufacturers and suppliers to transit agencies and motorcoach operators, these updates offer a snapshot of the projects, partnerships and business moves driving the industry forward.
Read More →
Massachusetts Approves $530M to Strengthen MBTA Operations, Infrastructure
The funding package targets operating stability, capital improvements, and fare affordability, offering a model for agencies navigating long-term funding challenges.
Read More →