
BLOGS: Bus bunching, diffusing conflict, congestion charging, etc.
2019's Cities with the Best (and Worst) Public Transportation
Ranks 100 U.S. cities across three key dimensions: Accessibility; Convenience; Safety; Reliability; and Public Transit Resources.
by Adam McCann
January 2, 2020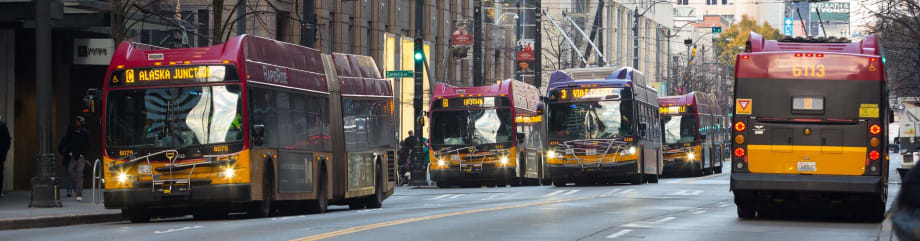
Seattle ranked as the "best" city for public transportation in the U.S. in a new report from WalletHub.
Photo: King County Metro
7 min to read
Public transportation may be a simple convenience or an absolute daily necessity, depending on the city and the size of its population. The scope of public transportation in giant metropolises like New York City can be massive.
According to the MTA, the New York City subway has over 665 mainland track miles and transports over 1.75 billion passengers per year. That’s not to mention the city’s 5,700 buses that carry over 760 million passengers per year.
There are many benefits to using public transportation over personal vehicles. The first is economic growth. According to the American Public Transportation Association, “every $1 invested in public transportation generates $4 in economic returns.” In addition, the APTA states that taking public transportation is cheaper in the long run than buying a vehicle and paying for its upkeep and gas costs. Public transportation also has drastically lower odds of an accident than driving a personal vehicle and helps to cut down pollution from emissions.
But not all cities have the same quality of public transportation. To find out where passengers will fare best during their daily commute, WalletHub compared 100 cities across 17 key metrics. Our data set ranges from share of commuters who use public transit and average age of the fleet to number of injuries and peak hours spent in congestion.
Main Findings
Cities with the Best Public Transportation
Overall Rank (1=Best) | City | Total Score | ‘Accessibility & Convenience’ Rank | ‘Safety & Reliability’ Rank | ‘Public Transit Resources’ Rank |
|---|---|---|---|---|---|
1 | Seattle, WA | 77.97 | 7 | 6 | 3 |
2 | Boston, MA | 77.84 | 2 | 34 | 10 |
3 | San Francisco, CA | 75.21 | 1 | 27 | 80 |
4 | Washington, DC | 71.23 | 3 | 48 | 52 |
5 | Madison, WI | 71.06 | 46 | 1 | 4 |
6 | Jersey City, NJ | 69.05 | 4 | 22 | 97 |
7 | New York, NY | 68.87 | 5 | 22 | 97 |
8 | Reno, NV | 68.13 | 76 | 8 | 1 |
9 | Honolulu, HI | 67.85 | 30 | 13 | 12 |
10 | Portland, OR | 66.82 | 13 | 31 | 29 |
11 | Minneapolis, MN | 66.72 | 8 | 51 | 31 |
12 | Denver, CO | 65.98 | 14 | 25 | 27 |
13 | Oakland, CA | 65.68 | 10 | 27 | 80 |
14 | Los Angeles, CA | 64.79 | 15 | 15 | 60 |
15 | San Jose, CA | 64.47 | 21 | 21 | 35 |
16 | Boise, ID | 64.45 | 82 | 3 | 37 |
17 | Lubbock, TX | 64.33 | 92 | 14 | 5 |
18 | Milwaukee, WI | 64.18 | 42 | 4 | 18 |
19 | San Diego, CA | 64.13 | 32 | 11 | 15 |
20 | Austin, TX | 63.66 | 19 | 68 | 2 |
21 | Baltimore, MD | 63.50 | 12 | 35 | 79 |
22 | Chicago, IL | 63.33 | 6 | 71 | 59 |
23 | Lincoln, NE | 63.10 | 24 | 20 | 46 |
24 | Chula Vista, CA | 62.46 | 89 | 11 | 15 |
25 | Laredo, TX | 61.52 | 99 | 5 | 43 |
26 | Santa Ana, CA | 61.48 | 35 | 15 | 60 |
27 | Long Beach, CA | 61.25 | 38 | 15 | 60 |
28 | Omaha, NE | 60.93 | 69 | 1 | 93 |
29 | Wichita, KS | 60.76 | 66 | 7 | 30 |
30 | Newark, NJ | 60.17 | 16 | 22 | 97 |
31 | Memphis, TN | 60.14 | 58 | 10 | 87 |
32 | St. Paul, MN | 59.00 | 27 | 51 | 31 |
33 | Pittsburgh, PA | 58.96 | 39 | 53 | 33 |
34 | El Paso, TX | 58.51 | 61 | 40 | 45 |
35 | Fremont, CA | 58.29 | 43 | 27 | 80 |
36 | Greensboro, NC | 58.21 | 57 | 43 | 36 |
37 | Cincinnati, OH | 58.17 | 37 | 42 | 40 |
38 | Irvine, CA | 57.88 | 70 | 15 | 60 |
39 | Toledo, OH | 57.77 | 77 | 58 | 7 |
40 | Albuquerque, NM | 57.67 | 11 | 88 | 19 |
41 | San Antonio, TX | 57.63 | 49 | 55 | 6 |
42 | Aurora, CO | 57.60 | 81 | 25 | 27 |
43 | Corpus Christi, TX | 57.43 | 54 | 67 | 8 |
44 | Anaheim, CA | 57.16 | 74 | 15 | 60 |
45 | San Bernardino, CA | 56.94 | 60 | 32 | 49 |
46 | Cleveland, OH | 56.65 | 18 | 73 | 53 |
47 | Atlanta, GA | 56.47 | 22 | 41 | 96 |
48 | Riverside, CA | 56.37 | 65 | 32 | 49 |
49 | Birmingham, AL | 56.15 | 97 | 30 | 44 |
50 | Durham, NC | 56.06 | 36 | 49 | 66 |
51 | Las Vegas, NV | 56.06 | 44 | 37 | 76 |
52 | Miami, FL | 55.86 | 20 | 45 | 94 |
53 | Tucson, AZ | 55.85 | 33 | 57 | 41 |
54 | Detroit, MI | 55.47 | 52 | 47 | 73 |
55 | Phoenix, AZ | 55.39 | 26 | 61 | 67 |
56 | Orlando, FL | 55.07 | 25 | 78 | 38 |
57 | Lexington-Fayette, KY | 54.96 | 63 | 77 | 11 |
58 | Anchorage, AK | 54.88 | 50 | 54 | 42 |
59 | Fort Wayne, IN | 54.85 | 88 | 50 | 55 |
60 | Colorado Springs, CO | 54.66 | 79 | 72 | 9 |
61 | Jacksonville, FL | 54.16 | 62 | 36 | 83 |
62 | Columbus, OH | 54.13 | 45 | 59 | 54 |
63 | Buffalo, NY | 53.91 | 40 | 56 | 75 |
64 | Stockton, CA | 53.82 | 90 | 9 | 84 |
65 | Dallas, TX | 53.78 | 29 | 79 | 20 |
66 | Nashville, TN | 53.73 | 31 | 60 | 85 |
67 | Scottsdale, AZ | 53.32 | 68 | 61 | 67 |
68 | Houston, TX | 53.32 | 34 | 70 | 65 |
69 | North Las Vegas, NV | 52.72 | 94 | 37 | 76 |
70 | Sacramento, CA | 52.09 | 51 | 44 | 90 |
71 | Virginia Beach, VA | 51.99 | 47 | 74 | 56 |
72 | Winston-Salem, NC | 51.63 | 85 | 69 | 14 |
73 | Raleigh, NC | 51.42 | 41 | 89 | 13 |
74 | Norfolk, VA | 51.18 | 48 | 74 | 56 |
75 | Irving, TX | 51.12 | 56 | 79 | 20 |
76 | Glendale, AZ | 50.84 | 98 | 61 | 67 |
77 | Garland, TX | 50.38 | 84 | 79 | 20 |
78 | Hialeah, FL | 50.28 | 83 | 45 | 94 |
79 | Fresno, CA | 50.22 | 71 | 87 | 26 |
80 | Henderson, NV | 50.09 | 95 | 37 | 76 |
81 | Louisville, KY | 49.83 | 64 | 85 | 47 |
82 | Chandler, AZ | 49.55 | 80 | 61 | 67 |
83 | Chesapeake, VA | 49.38 | 93 | 74 | 56 |
84 | Fort Worth, TX | 49.26 | 75 | 79 | 20 |
85 | Plano, TX | 49.13 | 78 | 79 | 20 |
86 | Mesa, AZ | 49.00 | 86 | 61 | 67 |
87 | Bakersfield, CA | 48.98 | 59 | 86 | 74 |
88 | Kansas City, MO | 48.76 | 23 | 93 | 34 |
89 | Philadelphia, PA | 48.73 | 9 | 97 | 86 |
90 | Gilbert, AZ | 48.52 | 100 | 61 | 67 |
91 | St. Louis, MO | 46.51 | 17 | 96 | 51 |
92 | Baton Rouge, LA | 46.26 | 91 | 91 | 17 |
93 | Arlington, TX | 45.70 | 96 | 79 | 20 |
94 | Oklahoma City, OK | 45.64 | 55 | 90 | 89 |
95 | Tulsa, OK | 43.02 | 72 | 94 | 48 |
96 | New Orleans, LA | 42.43 | 28 | 92 | 100 |
97 | Charlotte, NC | 40.67 | 53 | 95 | 88 |
98 | Tampa, FL | 24.69 | 67 | 98 | 91 |
99 | St. Petersburg, FL | 24.03 | 73 | 98 | 91 |
100 | Indianapolis, IN | 21.13 | 87 | 100 | 39 |
Survey Methodology
To determine the cities with the best and worst public transportation systems, WalletHub compared a sample of 100 U.S. cities across three key dimensions: 1) Accessibility & Convenience, 2) Safety & Reliability and 3) Public Transit Resources.
We evaluated those dimensions using 17 relevant metrics, which are listed below with their corresponding weights. Each metric was graded on a 100-point scale, with a score of 100 representing the most favorable living conditions.
Finally, we determined each city’s weighted average across all metrics to calculate its overall score and used the resulting scores to rank-order the cities in our sample. Our sample considers only the city proper in each case and excludes cities in the surrounding metro area.
Accessibility & Convenience – Total Points: 40
Share of Commuters Who Use Public Transit: Double Weight (~6.15 Points)
Average Commute Time for Transit Users: Full Weight (~3.08 Points)
Average Car Commute Time as Share of Average Public Transport Commute Time: Double Weight (~6.15 Points)
Transit Connectivity Index: Full Weight (~3.08 Points) Note: The TCI is a measure of how connected the average household member is to the availability of a transit ride.
Jobs Accessible Within a 30 Minute Transit Commute per 100 Civilian Employed Residents: Full Weight (~3.08 Points)
Peak Hours Spent in Congestion: Full Weight (~3.08 Points) Note: The total number of hours lost in congestion during peak commute periods compared to free-flow periods on a per capita basis. Peak corresponds to the absolute worst portion of the morning and afternoon commute, while free-flow is the best performance experienced over 24 hours.
Annual Public Transport Cost as Share of Median Annual Household Income: Double Weight (~6.15 Points)
Share of Commuters Who Prefer Public Transport: Full Weight (~3.08 Points) Note: This refers to commuters that choose public transportation even if they have one or more vehicles available.
Presence of Dedicated Rapid Bus & Rail Transport: Full Weight (~3.08 Points) Note: This binary metric measures the presence or absence of dedicated rapid bus and rail systems in a city.
Airport Accessibility by Public Transit: Full Weight (~3.08 Points) Note: This binary metric measures the presence or absence of a direct fixed-guideway access to an airport terminal or free bus shuttle access from rail station to an airport terminal.
Safety & Reliability – Total Points: 40
Public Transit Safety and Security Events per Passenger Miles Traveled: Full Weight (~10.00 Points) Note: Events include the following: collision, derailment, fire, security and not otherwise classified events.
Public Transit Injuries per Passenger Miles Traveled: Full Weight (~10.00 Points)
Public Transit Fatalities per Passenger Miles Traveled: Double Weight (~20.00 Points)
Public Transit Resources – Total Points: 20
Public Transport System Total Fixed Guideway Directional Route Miles per Urbanized Area Population: Full Weight (~4.00 Points) Note: The mileage in each direction over which public transportation vehicles travel while in revenue service.
Total Public Transit Vehicles Operated in Annual Maximum Service per Service Area Population: Double Weight (~8.00 Points) Note: The number of revenue vehicles operated to meet the annual maximum service requirement.
Average Age of Public Transit Fleet: Full Weight (~4.00 Points)
Average Lifetime Miles per Active Vehicles: Full Weight (~4.00 Points) Note: The total miles accumulated on all active vehicles since date of manufacture divided by the number of active vehicles.
Article, originally posted Sept.10, 2019, reprinted with permission from WalletHub.com
More Management

Building the Next Generation of Transit Technology
In this edition of METROspectives, Luminator CEO Magnus Friberg discusses the company's transformation, the growing role of AI and software, and what's next for transit technology.
Read More →
How Data, Strategy, and Community Engagement Are Reshaping Transit
In this edition of METROspectives, strada360 CEO Steve Lassey discusses how transit agencies can better align planning with operations, leverage data to improve decision-making, and build public trust as they prepare for the future of mobility.
Read More →
NJ TRANSIT Secures Capital Funding, Adopts FY2027 Budget
The budgets continue investments in infrastructure and equipment to maintain the system in a state of good repair and enhance the overall customer experience.
Read More →
Federal Railroad Administration Study Finds Upgrades Could Boost Penn Station Capacity by One-Third
The study outlines a roadmap for increasing train throughput while preparing Penn Station for future growth across the Northeast Corridor.
Read More →
Austin Transit Partnership Selects Stadler to Manufacture Light Rail Vehicles
The award marks the conclusion of a series of major procurements over 18 months, as outlined in ATP’s delivery plan, and keeps Austin Light Rail on track.
Read More →
June LA Metro Ridership Surges 2 Million Year Over Year
Total June ridership increased for both weekdays and weekends. Weekday ridership was 953,820, which grew 8.4% from June 2025; Saturdays increased nearly 13% year-over-year to 708,826; and Sundays increased 7.7% to 611,534 from June 2025, according to LA Metro.
Read More →
Washington's Pierce Transit Board Sends Transit Funding Measure to November Ballot
With the adoption of Resolution 2026-006, the measure moves to the Pierce County Auditor, giving voters in the Pierce Transit service area the decision on whether to fund an expansion of local transit service within the agency’s service area.
Read More →
Building the Next Generation of Transit Technology
In this edition of METROspectives, Luminator CEO Magnus Friberg discusses the company's transformation, the growing role of AI and software, and what's next for transit technology.
Read More →
EPA Proposal to Ease Diesel Emissions Compliance Could Improve Reliability for Motorcoach Operators
The EPA is proposing to remove DEF-related engine derates for new heavy-duty diesel vehicles, a change bus operators say would improve safety and reliability while sparking debate over the future of emissions enforcement.
Read More →
Act Now to Join Rays the Mark Foundation's Annual Golf Tournament, Fundraiser
This year's tournament honors Emily DeVito, a member of the public transportation family whose story has moved colleagues across the industry — and with only a few foursomes remaining, organizers are encouraging companies and individuals to register soon.
Read More →