

A recent APTA report, Understanding Recent Ridership Changes: Trends and Adaptations, has analyzed the changing transportation ecosystem and its impact on public transportation. It has identified four categories of factors: erosion of time competitiveness, erosion of cost competitiveness, reduced customer affinity and loyalty, and external factors beyond the control of a public transportation system.
Americans took 10.1 billion trips on public transportation in 2017
Compared to public transit ridership in 2016, there was a 2.9% decrease in ridership as bus ridership declined by 4.3%.
April 19, 2018
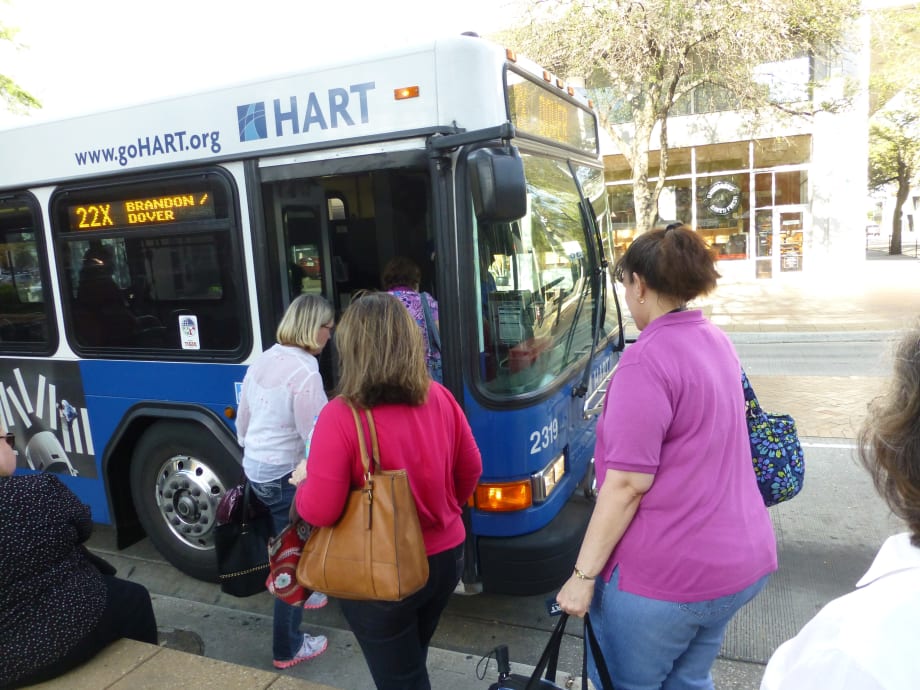
This innovative partnership between HART and a local transportation company provides rides to local bus stations within a three-mile radius. Photo: HART
4 min to read

Americans took 10.1 billion trips on public transportation in 2017, according to a report released by the American Public Transportation Association (APTA). Commuter rail and light rail ridership remained steady, with many public transit systems showing increases. Compared to public transit ridership in 2016, there was a 2.9% decrease in ridership as bus ridership declined by 4.3%.
Public transportation is an integral part of the new mobility transportation system and public transit systems are partnering with other transportation companies to offer first-mile and last-mile transportation to public transit stations. In Tampa, Fla., Hillsborough Area Regional Transit (HART) has a program called HyperLINK. This innovative partnership between HART and a local transportation company provides rides to local bus stations within a three-mile radius. A customer can call HART or use the HyperLINK app to book a trip.
In addition, some public transit systems are increasing bus service in frequency and in hours of service, and achieving new efficiencies such as in demand-response service. In Phoenix and Seattle, recent efforts have resulted in increased bus ridership. Thanks to a successful ballot initiative, the City of Phoenix is considering increased bus service hours and frequency to match the rail service within the city. In Seattle, King County Metro has expanded bus service seven consecutive times since 2015 and has also increased the frequency of bus service at all times across many of its 200-plus routes.
Dallas Area Rapid Transit (DART) is currently reworking its bus network to better serve core riders with reliable 15-minute rush hour frequencies. DART is also making bus routes more direct and more complementary to its light rail system. The San Francisco Municipal Transportation Agency (Muni) has added new routes, increased frequencies, and made changes to make bus routes more efficient, including consolidating some closely spaced stops. Muni is also adding new vehicles to replace their entire bus and light rail fleets.
Other public transportation systems are developing partnerships with community organizations to add new riders. In Albany, N.Y., the Capital District Transportation Authority (CDTA) has been able to keep ridership levels stable by placing emphasis on its growing Universal Access (UA) program with 20 partners from the education, health and service industries. This program accounts for more than 4 million trips annually, representing approximately 25% of CDTA’s annual ridership. In the past two years, UA ridership has increased by 50%.
To build customer loyalty and address the issue of cost competitiveness, the Washington Metropolitan Area Transit Authority has instituted the “rush-hour promise” for metro rail riders. If trips are delayed by 15 minutes or more, a customer will be offered a credit up to four times a month. Sacramento Regional Transit has reduced its K-12 Student Monthly Pass from $55 to $20 per month and has seen a 400 percent increase in K-12 Student Monthly Pass sales.
“While we are in a time of great change, in part due to technological innovations, public transit remains a critical part of any community’s transportation network,” said APTA President and CEO Paul P. Skoutelas. “Public transportation organizations are revamping their services and experimenting with pilot projects to be more time and cost competitive, and more customer focused to meet the needs of today’s riders and the growing population.”
2017 Ridership Breakdown
Nationally, commuter rail ridership increased in 18 out of 29 transit systems while overall ridership decreased by 0.2%. With a new rail line that opened in February 2017, commuter rail in Denver, saw an increase of 64.6%. The following two commuter rail systems saw double digit increases in 2017: Minneapolis (11.6%) and Portland, Maine (10.6%). Ridership in the following cities also saw increases in 2017: Salt Lake City (6.8%); Alexandria, Va. (4.2%); Oakland, Calif. (4.0%); Dallas-Ft. Worth (3.5%); Baltimore (3.3%); Seattle (3.2%); Anchorage, AK (2.7%); Nashville, Tenn. (2.5%); Stockton, Calif. (2.1%); Austin, Texas (1.9%); Pompano Beach, Fla. (1.8%); Harrisburg-Philadelphia, Pa. (1.1%); Boston (0.10%); New York, NY-MTA Metro-North Railroad (0.1%); and New York, NY-MTA Long Island Rail Road (0.04%).
Light rail (modern streetcars, trolleys, and heritage trolleys) ridership increased in 11 out of 29 transit systems while overall ridership decreased by 0.8%. Systems that showed double-digit increases in 2017 were in the following cities: Washington, D.C. (59.0%); Seattle – Sound Transit (20.9%); and Atlanta (15.8%). Light rail ridership in the following cities also saw increases in 2017: Seattle – King County Dept. of Transportation (4.4%); Minneapolis (3.7%); Los Angeles (3.2%); Houston (3.2%); Charlotte, N.C. (1.6%); Denver (1.2%); Dallas (0.5%); and New Orleans (0.2%).
Heavy rail (subways and elevated trains) ridership decreased nationally by 2.1% percent. However, heavy rail in the following cities showed ridership increases for 2017: Jersey City, N.J. – Port Authority of NY & NJ (5.3%); Lindenwold, N.J. – Port Authority Transit Corp. (1.7%); and New York, N.Y. – MTA Staten Island Railway (1.6%).
Bus ridership decreased nationally by 4.3% percent. The following cities showed the highest ridership increases at the nation’s large bus agencies: Phoenix (6.2%); San Francisco (1.9%); Arlington Heights, Ill. (1.0%); and Seattle – King County Dept. of Transportation (0.2%).
Demand-response (paratransit) ridership increased in 2017 by 0.4%.
More New Mobility
Biz Briefs: OCTA Taps Clean Energy for Hydrogen Station, Stadler to Supply Via Rail Vehicles, and More
From manufacturers and suppliers to transit agencies and motorcoach operators, these updates offer a snapshot of the projects, partnerships and business moves driving the industry forward.
Read More →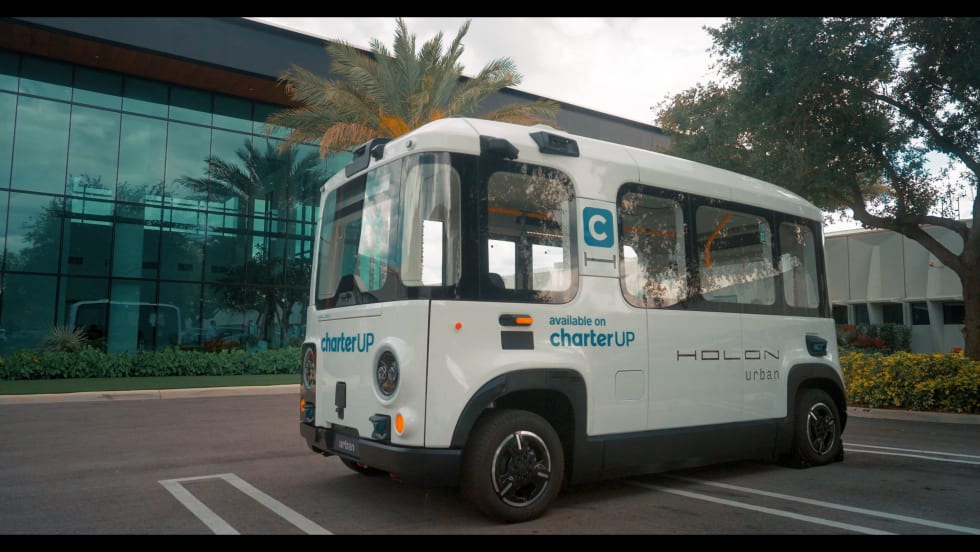
CharterUP Expands Into New Mobility and Autonomous Transportation
Vice President of New Mobility Stephen Joos discusses how CharterUP is leveraging its nationwide transportation network, technology platform, and autonomous vehicle partnerships to expand into workforce mobility, campus shuttles, and transit solutions.
Read More →
METRO Magazine Announces 2026 Innovative Solutions Awards Winners
Projects Recognized for Advancing Mobility Through Technology, Accessibility, Workforce Innovation, and Operational Excellence
Read More →Biz Briefs: STV teams with Amtrak, Motorcoach Operators Boost Fleet and Land Contracts, and More
From manufacturers and suppliers to transit agencies and motorcoach operators, these updates offer a snapshot of the projects, partnerships and business moves driving the industry forward.
Read More →
Biz Briefs: Masabi Teams with St. Louis Metro and More
In METRO's latest installment, we take a look at recent news from Transdev, Hitachi, and more partnerships making headlines across the transportation sector.
Read More →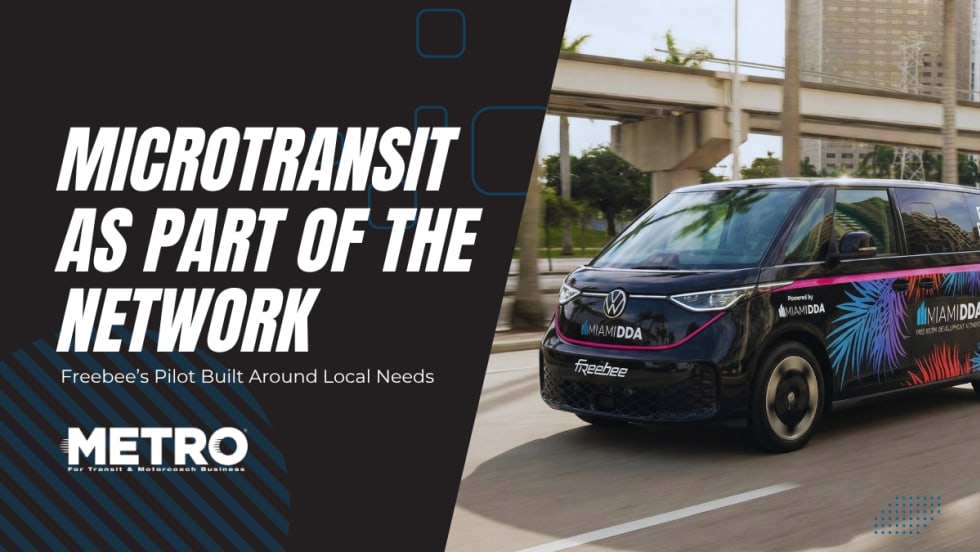
Microtransit's Next Test: Becoming Part of the Network
Freebee shows how electric microtransit is moving beyond pilots to fill network gaps, connect riders to transit, and prove lasting value.
Read More →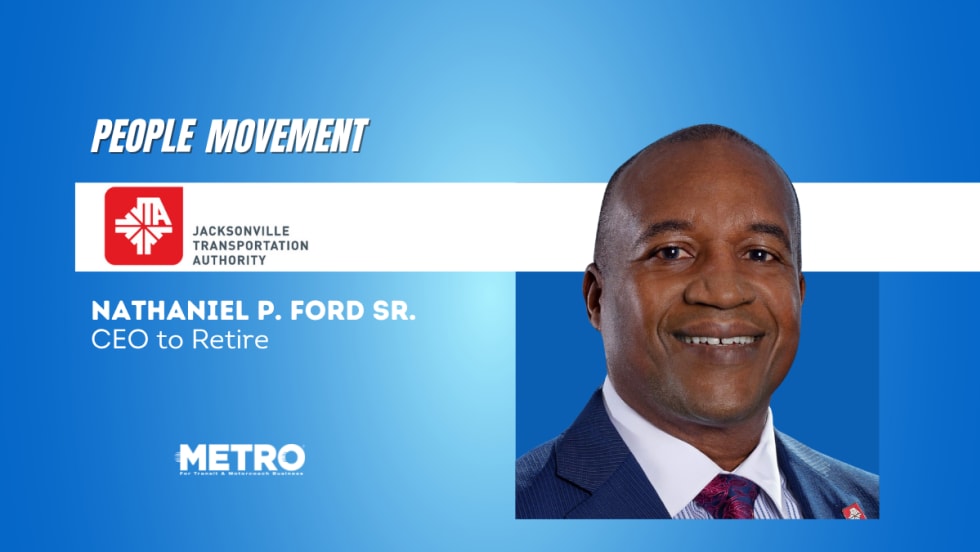
Ford to Leave JTA After More Than 10 Years as CEO
He plans to continue his work advancing innovative mobility solutions to improve the quality of life in communities across the nation. He did not announce specific plans.
Read More →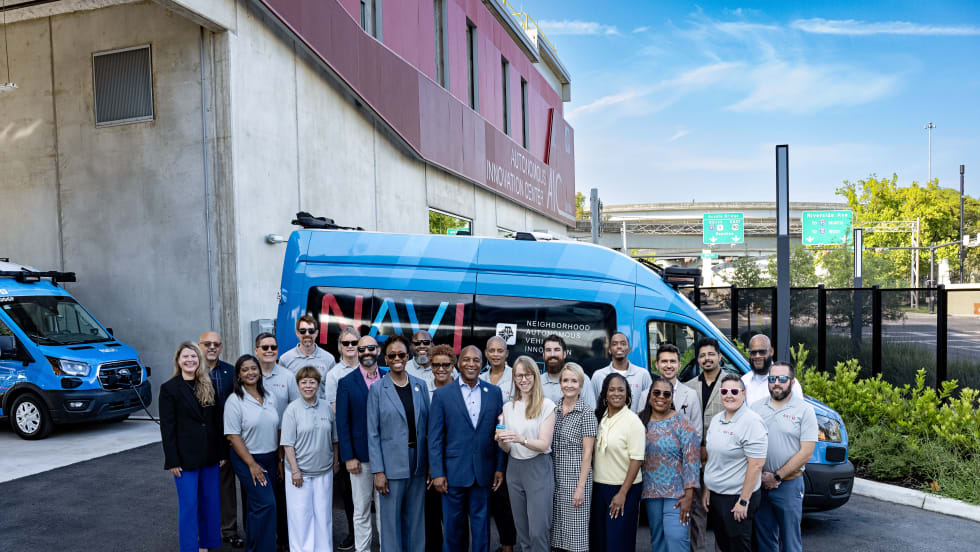
Florida's JTA Marks One Year NAVI Anniversary
During its first year of operation, NAVI has transported over 15,200 passengers and traveled more than 61,000 miles in autonomous mode without a safety incident caused by the autonomous driving system.
Read More →
SEPTA Board Approves FY2027 Budget Amid Funding Challenges
The spending plan represents an increase of just 1.9% over the current year and includes investments in new buses, additional full-length fare gates, and other customer enhancements.
Read More →
Biz Briefs: Endera Delivers to California, Safety Vision Teams with San Antonio's VIA, and More
From manufacturers and suppliers to transit agencies and motorcoach operators, these updates offer a snapshot of the projects, partnerships and business moves driving the industry forward.
Read More →