
L.A. is world's most gridlocked city, new report says
L.A. drivers spent 102 peak hours in congestion in 2017, followed by Moscow (91 hours), New York (91 hours), San Francisco (79 hours) and Bogota (75 hours).

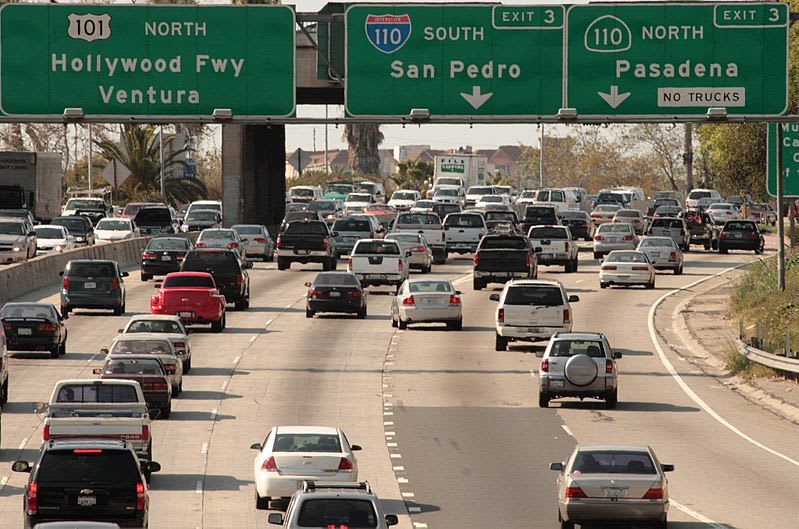
Los Angeles drivers spent 102 peak hours in congestion in 2017, followed by Moscow (91 hours), New York (91 hours), San Francisco (79 hours) and Bogota (75 hours). Photo: Wikimedia Commons/Myriam Thyes

Los Angeles topped the list of the world’s most gridlocked cities, with drivers spending 102 peak hours in congestion in 2017, followed by Moscow (91 hours), New York (91 hours), San Francisco (79 hours) and Bogota (75 hours), according to a new report.
The annual Global Traffic Scorecard report, published by INRIX, analyzed 1,360 cities — up by nearly 300 cities from the 2016 Scorecard — across 38 countries.
The U.S. ranked as the most congested developed country in the world, with drivers spending an average of 41 hours a year in traffic during peak hours, which cost drivers nearly $305 billion in 2017, an average of $1,445 per driver.
The U.S. had three of the top five most congested cities globally, with Los Angeles (first), New York (tied for second with Moscow) and San Francisco (fifth) costing an economic drain upwards of $2.5 billion caused by traffic. Angelenos spent an average of 102 hours last year in traffic jams during peak congestion hours, costing drivers $2,828 each and the city $19.2 billion from direct and indirect costs. Direct costs relate to the value of fuel and time wasted, and indirect costs refer to freight and business fees from company vehicles idling in traffic, which are passed on to households through higher prices.
Despite the high costs of congestion in Los Angeles and other cities, American drivers, in general, had it easier than their German counterparts. At $1,770, congestion cost the average German driver 57 percent more than an American, after adjusting for exchange rates and the cost of living. Detroit had the lowest cost of congestion among the top 25 U.S. cities, at $1,256 per driver, and ranked among the bottom in all three categories of costs: commuting, business and leisure/other.
“Congestion costs the U.S. hundreds of billions of dollars, and threatens future economic growth and lowers our quality of life,” said Dr. Graham Cookson, Chief Economist at INRIX. “If we’re to avoid traffic congestion becoming a further drain on our economy, we must invest in intelligent transportation systems to tackle our mobility challenges.”
Interestingly, both New York and San Francisco, the second- and third-ranked cities in North America (91 and 79 hours spent in congestion respectively), have a similar average congestion rate as Los Angeles (13 percent), but show different commute patterns. San Francisco, for example, had the highest congestion rate (tied with Boston) on arterial and city streets during the peak commute hours, while New York holds the top spot during the daytime.
Table 1: 10 Most Congested Urban Areas in the U.S.
2017 Rank (2016 Rank) City / Large Urban Area2017 Peak Hours in Congestion
(% of 2016 change) % of Total Drive Time in CongestionTotal Cost Per Driver in 2017Total Cost to the City in 2017 1 (1) Los Angeles, CA 102 (-2%) 12% $ 2,828 $19.2bn 2 (2) New York City, NY 91 (+2%) 13% $ 2,982 $33.7bn 3 (3) San Francisco, CA 79 (-5%) 12% $ 2,250 $10.6bn 4 (4) Atlanta, GA 70 (-1%) 10% $ 2,212 $7.1bn 5 (5) Miami, FL 64 (-2%) 9% $ 2,072 $6.3bn 6 (6) Washington, DC 63 (+3%) 11% $ 2,060 $6.1bn 7 (8) Boston, MA 60 (+3%) 14% $ 2,086 $5.7bn 8 (9) Chicago, IL 57 (0%) 10% $ 1,994 $5.5bn 9 (10) Seattle, WA 55 (0%) 12% $ 1,853 $5.0bn 10 (7) Dallas, TX 54 (-8%) 6% $ 1,674 $4.9bn
Downtown Metro Insights
Commuters within Boston and San Francisco had the highest U.S. congestion rates on arterial and city streets during the peak commute hours (23 percent).
But the worst downtown slowdowns were in El Paso, Texas where speeds dropped from 43 mph at free flow speeds to 5 mph when congested.
In and Out of City Insights
Drivers moved more quickly in the South. The top five fastest non-congested speeds during the peak period on highways were all in the South with Florida having the highest uncongested average speeds in 2017. Drivers in Fort Myers moved the fastest at an average of 68 mph.
Commuters around Everett, Washington spent more time stuck in traffic than anyone else, with a congestion rate of 28 percent on highways in and out of the city.
Business Impact
New York businesses suffered the most from congestion with an average of 14 percent of travel time on weekdays in gridlock and where drivers wasted the most daytime hours stuck in traffic in the entire U.S.
Santa Cruz, Calif. had the worst overall daytime congestion on arterial and highways with drivers spending 12 percent of their days sitting in traffic.
Weekend Insights
Getting to the beach was not easy at Dana Point, Calif. where drivers were stuck in congestion 21 percent of the time during weekends, the highest in the U.S.
Drivers cruised their slowest in Las Vegas, Nev. where weekend congestion speeds were just 5 mph.
The Most Congested Corridors in the U.S.
For the third year in a row, the (I-95) Cross Bronx Expressway in New York City tops the INRIX list of worst corridors, with the average driver on the 4.7 mile stretch wasting 118 hours per year in congestion, an increase of 37 percent over last year. For the third year in a row, the (I-95) Cross Bronx Expressway in New York City tops the INRIX list of worst corridors, with the average driver on the 4.7 mile stretch wasting 118 hours per year in congestion, an increase of 37 percent over last year.
Three other New York corridors fill out the top 10, but it should be pointed out that the NYCDOT has taken various positive actions to improve safety and operations. For example, under NYC’s Vision Zero programs the official speed was lowered to reduce traffic fatalities and improve safety for a mix of bicycles, pedestrians, buses, and delivery trucks along local streets.
Surprisingly, Los Angeles, with the top spot in terms of peak hours sitting in congestion in the world, only holds one spot on the list – I-10 Eastbound between I-405 and I-110. San Francisco, the third highest ranking city in the U.S. for peak time spent in congestion, does not appear on the US worst corridors list until number 31.
Table 2: 10 Most Congested U.S. Roads in 2017
RankCity / Large Urban AreaRoadFromToWorst Peak PeriodHours of Delay 1 New York, NY I-95 Eastbound Exit 1C/Alexander Hamilton Brdg W Exit 6A/I-278 PM 118 2 Chicago, IL I-90/I-94 Southbound Exit 53C/I-55 Exit 34B/Lake Ave E AM 98 3 Chicago, IL I-290 Eastbound Exit 15A/I-88 Exit 28B/Paulina St AM 89 4 Los Angeles, CA I-10 Eastbound Exit 3A/S Figueroa St Exit 13/I-110 PM 74 5 Pittsburgh, PA I-376 Eastbound Exit 65/Academy St Exit 77/Edgewood AM 66 5 Chicago, IL I-90 Southbound Exit 50A/N Ogden Ave Exit 43C/Montrose Ave AM 66 7 New York, NY E 34th St FDR Dr 5th Ave AM 59 8 New York, NY Belt Pkwy E Exit 3/I-278 Exit 17/Cross Bay Blvd PM 57 9 New York, NY E 42nd St FDR Dr 7th Ave PM 56 10 Boston, MA I-93 Southbound Exit 20B/Albany St Exit 8/Furnace Brook Pkwy PM 55
How the U.S. Cities Compare to Top Cities Worldwide
At the global level, Los Angeles topped the list of the world’s most gridlocked cities, with drivers spending 102 peak hours in congestion in 2017, followed by Moscow (91 hours), New York (91 hours), San Francisco (79 hours) and Bogota (75 hours).
Table 3: 10 Most Congested Cities in the World in 2017
2017 RankGlobal CityCountryContinent2017 Hours Spent in Congestion Percentage of Total Drive Time in Congestion 1 Los Angeles U.S. North America 102 12% 2 Moscow Russia Europe 91 26% 2 New York City U.S. North America 91 13% 4 Sao Paulo Brazil South America 86 22% 5 San Francisco U.S. North America 79 12% 6 Bogota Colombia South America 75 30% 7 London U.K. Europe 74 13% 8 Atlanta U.S. North America 70 10% 9 Paris France Europe 69 13% 10 Miami U.S. North America 64 9%
Of the 38 countries covered by the INRIX 2017 Traffic Scorecard, Thailand leads with the highest average hours spent in peak congestion (56 hours), outranking Indonesia (51 hours) and Columbia (49 hours), followed by Venezuela (42), and the U.S. and Russia both with 41 hours. Among developed nations, U.S. and Russia shared top of the most congested countries in the world.
Table 4:15 Most Congested Countries in the World in 2017
2017 Rank
(2016 Rank) CountryContinent 2017 Peak Hours Spent in Congestion 1 (1) Thailand Asia 56 2 (2) Indonesia Asia 51 3 (2) Colombia South America 49 4 (6) Venezuela South America 42 5 (4) Russia Europe 41 5 (5) U.S. North America 41 7 (8) Brazil South America 36 7 (7) South Africa Africa 36 9 (10) Turkey Europe 32 10 (11) U.K. Europe 31
More Management
Turn Transit Data Into Action
Discover how leading agencies are using connected technology to gain real-time visibility across operations, improve service reliability, and reduce disruptions.
Read More →
What Transit-Oriented Development Means for the Future of Public Transportation
Once viewed primarily as transit operators, agencies are now leveraging land, partnerships, and long-term planning to boost ridership, expand housing, and strengthen communities.
Read More →
USDOT Announces $22 Million for Transit Innovation, Updates High-Speed Rail Rules
New federal transit funding will support safety, accessibility, and technology projects as updated rail regulations establish new noise standards for high-speed trains.
Read More →
Transportation Construction Coalition Unveils Infrastructure Case Studies Ahead of Federal Funding Deadline
The coalition noted the next surface transportation bill should provide sustained investment in highways and public transit to strengthen freight movement, improve safety, and support economic growth.
Read More →
People Movement: American Bus Association Extends Ferguson and More
METRO’s People Movement highlights the latest leadership changes, promotions, and personnel news across the public transit, motorcoach, and people mobility sectors.
Read More →
METRO Magazine Announces 2026 Innovative Solutions Awards Winners
Projects Recognized for Advancing Mobility Through Technology, Accessibility, Workforce Innovation, and Operational Excellence
Read More →
MBTA Rolls Out Pilot Programs to Cut Costs, Simplify Travel
Three new fare pilots — including unlimited two-hour transfers, reduced express bus fares, and free transit for eligible seniors — will launch this fall as Massachusetts extends popular commuter rail discounts through November.
Read More →
FTA Opens $610 Million Funding Opportunity for Bus Infrastructure Projects
The latest Notice of Funding Opportunity provides transit agencies with funding for bus facilities, fleet modernization, and low- and no-emission vehicles, with applications due September 21.
Read More →Biz Briefs: STV teams with Amtrak, Motorcoach Operators Boost Fleet and Land Contracts, and More
From manufacturers and suppliers to transit agencies and motorcoach operators, these updates offer a snapshot of the projects, partnerships and business moves driving the industry forward.
Read More →
Massachusetts Approves $530M to Strengthen MBTA Operations, Infrastructure
The funding package targets operating stability, capital improvements, and fare affordability, offering a model for agencies navigating long-term funding challenges.
Read More →